B2B SaaS Marketing Analytics: Metrics, Benefits & the Growth Loop

Founder, Grow Predictably · 15+ yrs building B2B revenue systems

TL;DR: B2B SaaS marketing analytics is the practice of measuring and interpreting marketing data so a team can see which campaigns actually drive sign-ups, revenue, and retention, then move budget to what works. Most teams drown in dashboards and still guess. The teams that grow do one thing differently. They track to optimize, and they optimize to grow.
Key Takeaways
- Analytics earns its keep only when it changes a decision; a dashboard that has not moved a budget choice this quarter is just an expensive status report.
- Defending existing accounts usually beats funding another acquisition push, because Bain research via Harvard Business Review ties a five-point retention gain to a profit jump of 25% to 95%.
- Track three numbers before any others: conversion rate, ROI, and lifetime value per account, since each connects spend to revenue you can actually bank.
- A repeatable cycle from goals to measurement to insight to action converts data into decisions, and CoSchedule found goal-setters are 377% more successful than peers.
- Forrester reports insights-driven firms are close to three times likelier to post double-digit revenue growth, but only when the finding reaches whoever can act on it.
Most B2B SaaS marketing dashboards are busy and silent at the same time. Traffic lines move, sign-up counts wobble, and nobody in the room can say which campaign produced last quarter’s revenue. That gap is about how the data gets read, and it is where analytics either earns its keep or becomes expensive wallpaper.
This guide walks through what SaaS marketing analytics is, the four benefits that matter, the three metrics to watch first, the five-step measure-to-optimize loop, and the advanced techniques worth adding once the basics hold.
This is for the B2B SaaS founder, head of growth, or marketing lead who is funding five channels, watching the numbers climb, and still cannot prove what is working.
The work that follows is what diagnose-first analytics looks like at the campaign layer: reading the data you already have at the one stage capping growth, rather than collecting more of it.
What is B2B SaaS marketing analytics?
B2B SaaS marketing analytics is the practice of measuring and acting on marketing data to see how well a subscription business turns attention into sign-ups, revenue, and retained accounts. The part most teams miss: the goal isn’t more data. It’s the one decision that data should change this week.
Good analytics follows a buyer from first click to paying customer, then to renewal and expansion. That’s also what separates analytics from reporting, and the distinction is worth being precise about:
- Reporting describes. It tells you traffic rose 12% last month.
- Analytics decides. It tells you the trial page from your paid social campaign converts at half the rate of your organic traffic, so the next dollar belongs on organic.
When I read a B2B SaaS funnel, the first thing I hunt for is the single number that, if it moved, would change where the next dollar goes.
The trap in between is the vanity metric. Pageviews, impressions, and follower counts feel like progress because they move, but they rarely map to revenue.
What actually matters is tracking the transitions that decide the business:
- Visitor to trial
- Trial to activated
- Activated to paid
- Paid to retained
- Retained to expansion
If a number doesn’t sit on one of those transitions, it’s usually decoration.
This isn’t just a framing preference. According to Forrester’s Indranil Bandyopadhyay, firms with advanced insights-driven capabilities are nearly three times more likely than beginner-level companies to report double-digit year-over-year revenue growth. That lift comes from reading the dashboards you already have and acting on the leaks they expose, not from buying more of them.
If your analytics hasn’t changed a decision this quarter, it’s functioning as a report.
Why does SaaS marketing analytics matter for B2B SaaS growth?
SaaS marketing analytics matters because it turns marketing from a cost center that reports activity into a system that defends revenue. It shows which channels bring buyers who stay and where acquisition spend is wasted.
For a B2B SaaS team, there are four highest-value uses:
- Sharper targeting
- Lower acquisition cost
- Stronger retention
- Earlier upsell signals
Sharper targeting comes first. Analytics reveal which segments actually convert and which just consume budget, so you can build campaigns around a real customer avatar rather than a guess about who your buyer is.
When you see that mid-market operations leads convert three times better than enterprise IT on the same offer, your targeting stops being a debate and becomes a decision.
That same read lowers customer acquisition cost. Instead of spreading spend evenly, you concentrate it on the channels that deliver paying accounts and cut the ones that deliver clicks. The discipline here is watching acquisition cost and lifetime value together.
A common B2B SaaS benchmark, popularized by David Skok’s SaaS Metrics guide, is that a healthy business keeps lifetime value at least three times acquisition cost. Analytics tells you whether you clear that bar at the channel level, where a blended average can hide a failing channel.
The diagnostic move matters more than the average. When blended acquisition cost climbs, the tempting response is to cut the total ad budget. I’d argue the better response is to find the specific channel dragging the average, because the problem is rarely spread evenly.
One paid channel bringing low-intent trials that never activate can mask three channels performing well. Cut the one channel, not the whole budget, and the average corrects without starving the winners.
Retention is where the math gets loud. The pattern I see most often is a team bolting on another acquisition channel while a fixable retention leak quietly drains the gain:
- The visible symptom is steady acquisition with flat 90-day revenue.
- The upstream cause is usually a promise made at the point of conversion that no onboarding email can fully repair: the gap in the B2B SaaS customer journey that nobody owns.
Analytics catches the churn signal early, through drops in feature usage or login frequency, while there’s still time to intervene with a check-in or a targeted offer.
Increasing customer retention rates by 5% increases profits by 25% to 95%.
— Frederick Reichheld, Bain & Company (Harvard Business Review)
That figure, reported by Harvard Business Review, is why retention analytics outrank another acquisition push for most B2B SaaS teams I work with. Winning back a percentage point of retention compounds every month, while a percentage point of new acquisition has to be won again next month.
The fourth use, upsell, works the same way in reverse. Usage data shows which accounts lean hardest on a capped feature or seat limit, and those are the accounts ready for a premium tier before they ever ask. Marketing analytics turns that pattern into a timed expansion campaign instead of a lucky guess.
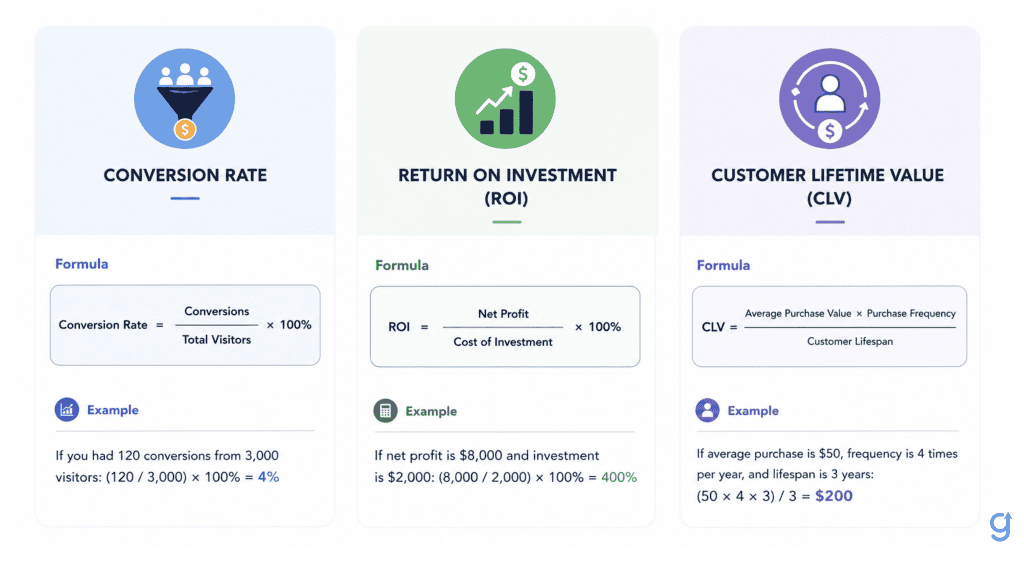
Which SaaS marketing metrics actually matter?
Three metrics tie marketing effort to revenue for a B2B SaaS business: conversion rate, return on investment, and customer lifetime value. Everything else is context.
Together, these three answer the questions that actually matter:
- Are you turning attention into customers?
- Did the spend pay off?
- Are those customers worth more than they cost to acquire?
Conversion rate measures the share of visitors who take the action you want, from trial sign-up to paid upgrade. The formula is straightforward:
Conversion Rate = (Number of Conversions / Total Visitors) x 100
For example, 50 conversions from 1,000 visitors is a 5% conversion rate. But a single number in isolation flatters or scares you, so benchmarks keep you honest.
According to ChartMogul’s analysis of 200 B2B software products, the median free-to-paid conversion rate is just 8%, while trials that require a credit card convert at roughly 30%.
Here’s how I read that against your own numbers:
- If your opt-in trial converts at 9%, you’re near the median, and the lever is activation.
- If it converts at 3%, the problem is upstream in targeting or the trial experience.
Return on investment shows whether a campaign paid for itself:
ROI = ((Revenue from Campaign – Campaign Cost) / Campaign Cost) x 100
A campaign that returns 10,000 dollars on a 2,000 dollar spend runs a 400% ROI. The discipline is measuring ROI per channel and per campaign, because a blended average hides the losers inside the winners.
Customer lifetime value predicts the total revenue a single account returns across the relationship:
CLV = (Average Purchase Value x Average Purchase Frequency) x Customer Lifespan
Read the three together, and you avoid the most common B2B SaaS mistake, which is optimizing acquisition cost in isolation while lifetime value quietly falls. A cheaper customer who churns in two months is more expensive than a pricier one who stays two years. The trap I watch for is a blended CAC-to-LTV ratio that looks healthy while one channel underneath it runs quietly upside down.
A related metric worth tracking is CAC payback period, the number of months of revenue it takes to earn back what you spent to acquire an account. A channel can look cheap on cost and still strain cash flow if payback runs long.
Two practices keep these numbers trustworthy:
- Attribution. Deciding how credit for a conversion is split across the touchpoints a buyer saw, since a first-touch model and a multi-touch model can name different channels as the winner.
- Cohort-level reporting. Reading metrics by cohort instead of in aggregate, so you can see whether accounts that signed up in March retain better than the ones from January. Aggregate averages hide the trend a cohort view makes obvious.
To make retention measurable early, many B2B SaaS teams also add a leading indicator like Net Promoter Score, which flags satisfaction shifts months before they surface as churn in the revenue numbers.
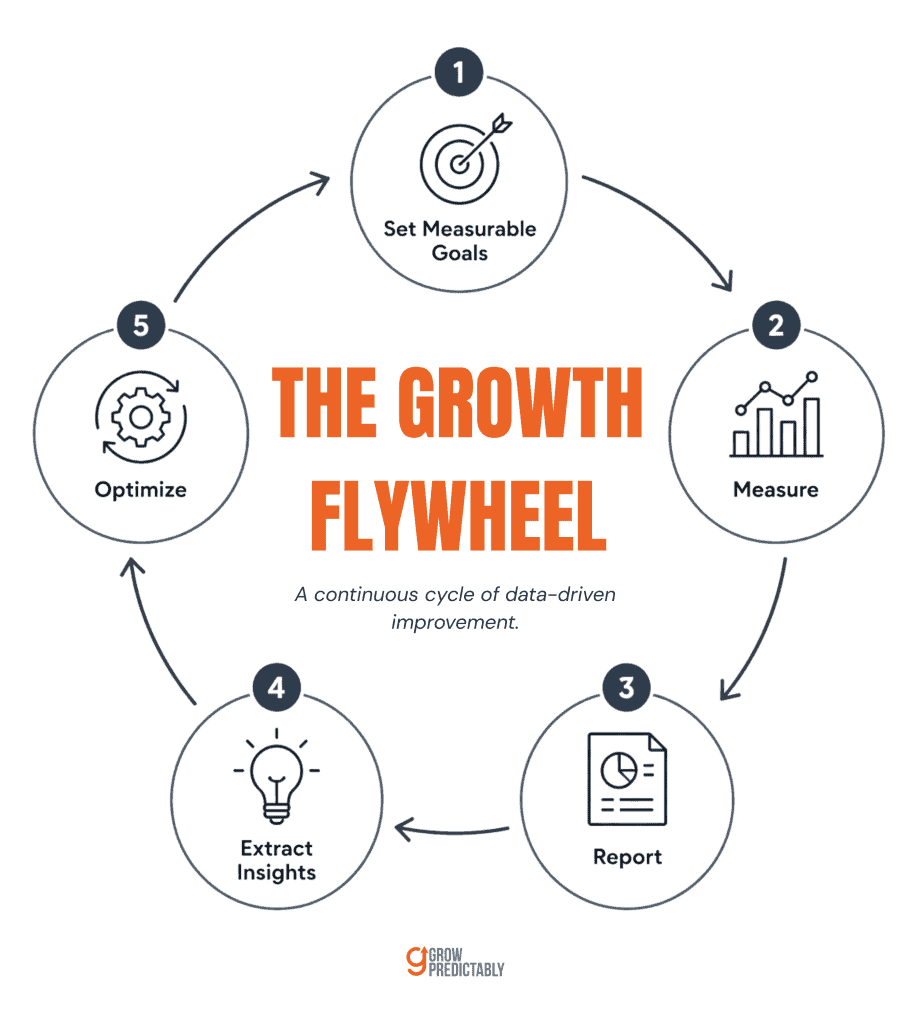
How do you turn SaaS marketing analytics into better decisions?
You turn analytics into decisions by running a loop, not a report. The five-step measure-to-optimize sequence is set measurable goals, measure, report, extract insights, and optimize, then repeat.
Each pass narrows the question from “what happened” to “what should change”. The discipline is what stops data from being interesting and starts it being useful.
I got formally trained in this discipline through an MIT digital analytics program, and DigitalMarketer’s analytics specialization, and the same pattern shows up in every B2B SaaS funnel I read: the stage capping growth is rarely the one the team is watching.
- Set measurable goals. Break each business goal into objectives, then into KPIs you can actually track, like trial-to-paid rate or 90-day retention. A vague goal like “grow faster” cannot be optimized. A specific one like “lift trial-to-paid from 8% to 11% this quarter” can. Goal-setting does real work here. CoSchedule found that marketers who set goals are 377% more successful than those who do not.
- Measure. Choose the KPIs that map to those goals before you open Google Analytics 4, Mixpanel, or Amplitude, so the dashboard serves the question instead of burying it. Pair every lagging KPI, like closed revenue, with a leading one, like activated trials, so you can see problems forming instead of only autopsying them.
- Report. Build a report anyone on the team can read in a minute. Track the few metrics that move your KPIs and set the rest aside, because a report nobody reads is pure cost. The test of a good report is whether a new team member could point to the one number that matters without being told.
- Extract insights. This is where raw data becomes a decision, and it is the step most teams skip. As Avinash Kaushik, author of Web Analytics 2.0 and Google’s former Digital Marketing Evangelist, frames the real test of any report: “What amongst the data I have provided today will create happier customers tomorrow?” A chart that changes no action is decoration. An insight sounds like “trials from the pricing page convert at half the rate of trials from the demo page”, where “trials are down” is only the symptom.
- Optimize. Apply the change to the one stage the insight named, then measure again. If sign-ups leak on the pricing page, you fix the pricing page before you touch the ad creative, and you keep everything else constant, so the next measurement is clean.
Walk one example through the loop. The goal is lifting trial-to-paid. You measure and find activation is healthy, but the upgrade prompt only appears after the free plan’s value is spent. The insight is that timing is the constraint, while the messaging is fine.
You optimize by moving the prompt to the moment a user hits the feature cap, then measure the next cohort. That is one full turn, and it beats changing the headline, the price, and the email sequence all at once.
The tempting anti-pattern is to skip straight to optimize, changing five things because all five look off. That produces motion, not lift, because you can no longer tell which change worked. Move one stage at a time, and the loop compounds instead of thrashing.
What advanced SaaS marketing analytics techniques are worth adopting?
Once the five-step loop runs cleanly, three advanced techniques add leverage:
- Predictive analytics
- Real-time analytics
- Cross-functional integration
Each one earns its place only after the basics hold, because advanced analytics on a broken measurement foundation just produces confident wrong answers faster.
When a team asks me which of the three to add first, I almost always point to integration, because a predictive model is only as good as the shared definitions feeding it.
Tool choice should follow the job in front of you. Product analytics platforms like Mixpanel and Amplitude answer in-app behavior questions such as which features drive activation. Google Analytics 4 covers acquisition and web traffic.
A subscription analytics tool like ChartMogul tracks recurring revenue metrics such as churn and expansion. The common mistake is buying a platform before naming the question it should answer, which is how teams end up with three dashboards and no decisions.
Pick the tool that answers the question capping your growth right now, then add the next one when a new question earns it.
Predictive analytics uses past behavior to forecast churn, upgrade likelihood, and campaign outcomes, so you act before an account leaves rather than after.
A churn model that scores accounts on declining logins and support tickets lets customer success reach the at-risk account while there’s still time. This is the frontier Forrester ties to AI-assisted decisions, where models surface the risk while a human still owns the intervention.
Real-time analytics shows campaign performance as it happens, which shortens the feedback loop from weeks to hours. During a product launch or a paid push, that speed lets you kill a losing ad set before it spends the week’s budget. The tradeoff is real, though:
- Real-time feeds demand cleaner data pipelines and more skilled hands.
- A noisy live dashboard can push a team into overreacting to normal daily variance.
The fix is setting thresholds in advance, so you act on a genuine signal and ignore the daily wiggles.
Integration is the technique most teams underinvest in, and the one with the highest ceiling. When marketing, sales, and support read the same data:
- Marketing learns which leads actually closed.
- Support surfaces the churn reasons marketing never sees.
- Product learns which features hold accounts.
The failure mode is siloed tools that each tell a partial story, so the same customer looks healthy in one system and at-risk in another. That’s exactly where combining AI and automation across B2B SaaS processes pays off, by moving one shared read between teams instead of four conflicting ones. Integration is mostly a matter of agreement.
When “active account” means the same thing to every team, the same data stops telling four different stories.
Where should your B2B SaaS team start with marketing analytics?
The first move is to read what your current numbers already show about where growth stalls, before you buy another analytics tool. Map your last five campaigns against the five-step loop, find where sign-ups leak, and fix that stage first.
Start with the full B2B SaaS marketing system that puts these metrics in one place, so the loop runs on one source of truth instead of five scattered dashboards.
Frequently Asked Questions
About the author
Brian helps B2B founders install marketing + automation engines powered by Co-Thinking with AI. With 15+ years building predictable revenue systems, he's worked with SaaS, agency, and service businesses on 90-day done-with-you growth accelerators.
Ready to install your predictable revenue engine?
Book a free strategic growth session. Walk away with a tailored 90-day blueprint and 3 quick wins you can use this week.