SaaS Churn Benchmarks: What Your Number Means

Founder, Grow Predictably · 15+ yrs building B2B revenue systems

TL;DR: A B2B SaaS churn benchmark is the average rate at which subscription customers cancel, near 3.5 to 4.9 percent annually in 2025, with healthy companies under 1 percent monthly. But the average is a clue, not a target. A churn rate well above benchmark almost never means broad retention failure. It means one upstream constraint, usually a weak first win after the sale, and the gap is the most useful diagnostic you have.
Key Takeaways:
- Average B2B SaaS churn sits near 3.5 to 4.9 percent annually in 2025, and good is below 1 percent monthly, per Vena’s 2025 benchmarks citing Recurly and Paddle.
- A single industry average is the least useful number on your dashboard, because the right benchmark is the one matched to your ACV, contract length, and segment.
- Roughly 20 to 40 percent of total churn for many subscription businesses is involuntary, meaning failed payments you can recover, not customers who left unhappy (Kaplan 2025 payment statistics).
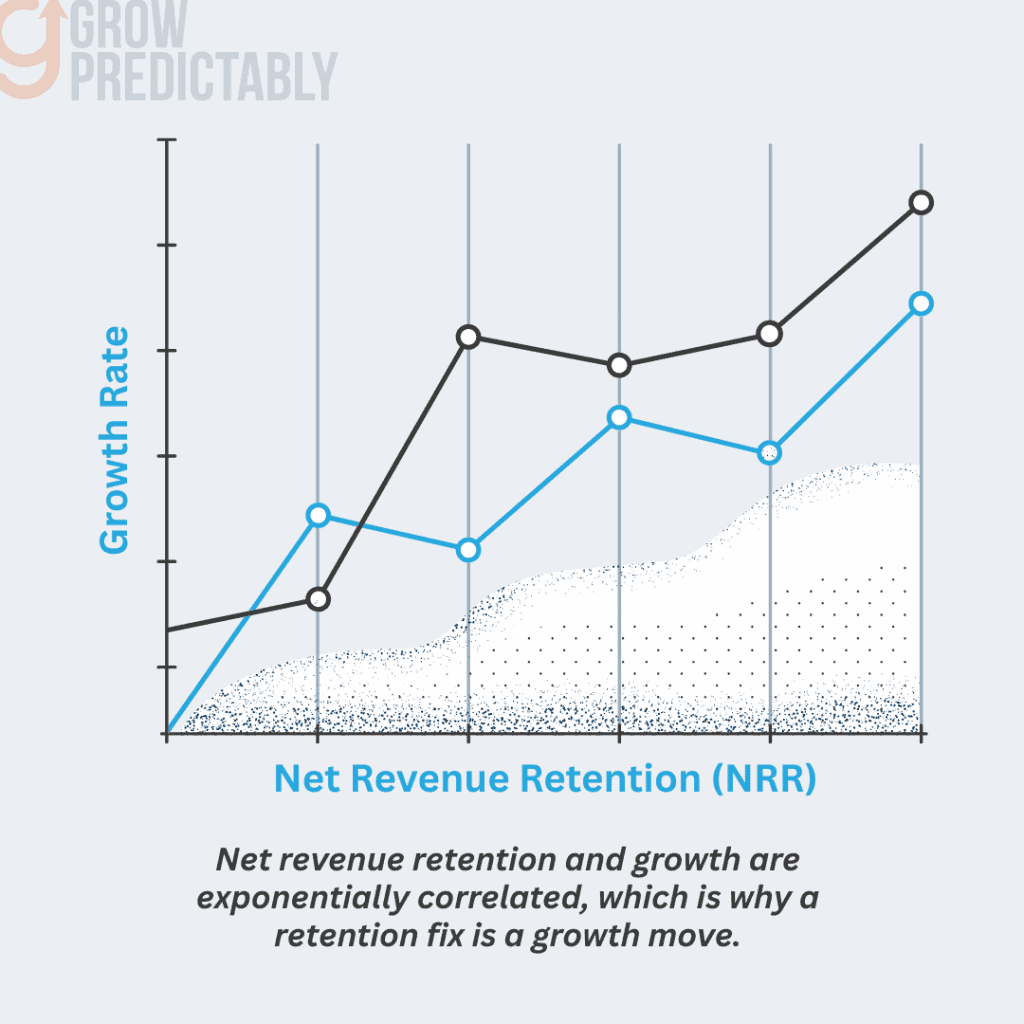
- Median private B2B SaaS net revenue retention is near 101 percent and top-quartile companies report 118 to 120 percent, with a strong exponential link between NRR and growth (SaaS Capital 2025).
- The fastest move when your churn is above benchmark is to decompose the number with the Churn Decomposition Read, then instrument one first-win moment for one cohort, not to buy more leads.
I have watched this pattern more times than I can count. A founder pulls their churn number, sees it sitting near 8 percent, and reacts to the gap between their number and the industry average as if the whole retention machine is broken. Then they do the thing that feels like progress and quietly makes it worse.
They pour the next quarter into more traffic and more leads to outrun the leak. As a DigitalMarketer Certified Partner (since 2020) who has spent years inside B2B SaaS growth, I’ll walk you through three things in this piece: how to read a churn benchmark correctly, how to decompose your own number with a plain diagnostic I call the Churn Decomposition Read, and how to find the single constraint behind it using a Theory of Constraints lens.
This is for the B2B SaaS founder or marketing leader staring at a dashboard, number-anxious but not finance-fluent, quoting one churn figure without knowing whether it’s revenue or logo, voluntary or involuntary. That confusion is your opening, not your failure.
What follows is what diagnose-first looks like at the metrics layer: not another benchmark table to measure yourself against, but the operator move that turns one scary number into one located problem you can actually fix.
Why is my B2B SaaS churn rate at 8% when the industry average is 3.5%?
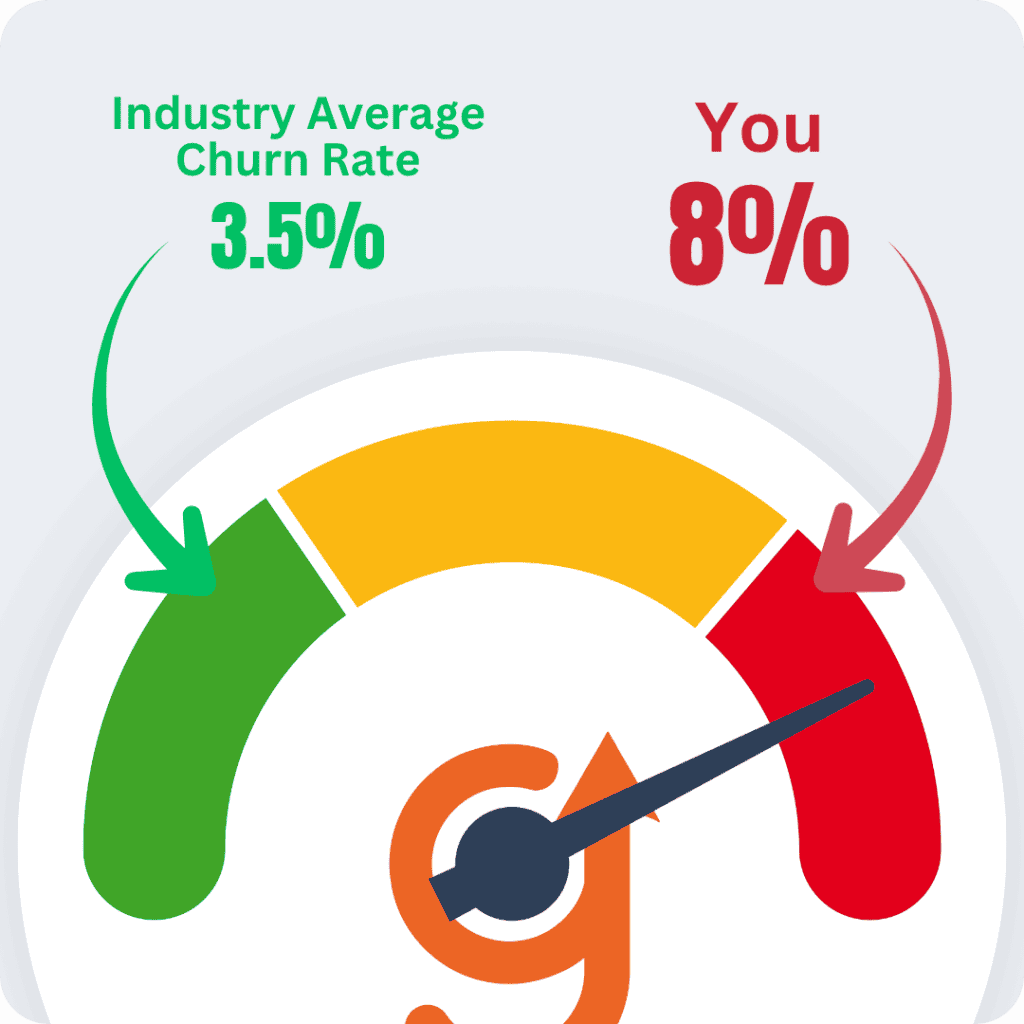
Because the average isn’t telling you what you think it’s telling you. A churn rate that far above benchmark isn’t a vague, broad retention failure spread across your whole base. It’s almost always one specific constraint leaking value, and the size of the gap is the most useful diagnostic signal you have. The number is the symptom. The constraint is the answer.
Here’s the benchmark first, so we agree on the math. Average annual B2B SaaS churn runs near 3.5 to 4.9 percent in 2025, and good is considered below 1 percent monthly and below 5 percent annually, according to Vena’s 2025 churn data citing Recurly and Paddle. So an 8 percent number really is more than double the healthy range. The alarm is real.
But here’s what I learned the slow way. Most businesses chase the front end. They optimize for awareness, traffic, and leads, because that’s where the dashboards are loudest. The constraint is almost never there. It sits downstream, in the handoff between when someone buys and when they get their first real win.
Growth problems are usually retention problems wearing an acquisition costume. Your 8 percent is the costume. Underneath it is one move you haven’t engineered yet.
What is a good B2B SaaS churn rate, and which benchmark applies to you?
A good B2B SaaS churn rate is below 1 percent monthly and below 5 percent annually, with the 2025 average near 3.5 percent. But a single average is the least useful number on this page. The benchmark that matters is the one matched to your ACV, contract length, and segment, because an SMB tool and an enterprise platform live in completely different worlds.
Annual versus monthly churn
First, get the unit right. People quote churn in both monthly and annual terms and then compare across the two without noticing. A 1 percent monthly churn rate compounds to roughly 11 to 12 percent annually, not 1 percent. When you read that average B2B SaaS churn is near 3.5 percent, per Recurly’s 2025 data summarized by Vitally, confirm you’re comparing the same unit before you panic.
Half of the “my number is terrible” calls I take resolve here.
SMB, mid-market, and enterprise spreads
Second, locate yourself in the right cohort. Self-serve SMB products with low ACV and month-to-month billing carry structurally higher churn than enterprise platforms on annual contracts. Baremetrics open benchmarks show revenue churn varying sharply by ARPU tier, with low-ARPU self-serve products running materially higher than enterprise tiers on annual contracts, which is a wide spread. So if you’re an SMB tool comparing yourself to an enterprise average, you might be sounding a false alarm.
And if you’re an enterprise platform comparing yourself to an SMB average, you might be taking false comfort while a real leak grows. The average flattens exactly the differences you need to see. Find the cohort that looks like you, then read your number against that.
Which churn are you actually measuring? Revenue, logo, voluntary, involuntary
Before you do anything else, find out which churn you actually have. Most founders quote one number without knowing whether it’s revenue or logo, voluntary or involuntary. These aren’t accounting trivia. They point at completely different fixes, and decomposing the number is often where half the scary gap disappears.
Revenue churn versus logo churn
Logo churn counts accounts lost. Revenue churn counts dollars lost. They diverge hard when your customer base isn’t uniform. Lose ten tiny accounts and one whale, and your logo churn looks modest while your revenue churn spikes. Lose the ten tiny accounts and keep the whale, and the reverse happens.
So the first question is which one your 8 percent even is. If your benchmark comparison uses logo churn but your business is concentrated in a few big accounts, you’re measuring the wrong thing for your own risk.
Voluntary versus involuntary churn
Here’s the one that surprises people most. A large slice of what shows up as “churn” is involuntary, meaning a credit card expired, a payment failed, a renewal didn’t process. Recurly’s 2025 data puts average B2B SaaS churn at 3.5 percent, split into roughly 2.6 percent voluntary and 0.8 percent involuntary. And Kaplan’s 2025 subscription statistics put involuntary churn at roughly 20 to 40 percent of total churn for many subscription businesses.
Read that again.
Up to four in ten of your “lost” customers may not have chosen to leave at all. That’s a recoverable billing problem, not a dissatisfaction problem. Before you redesign your product over an 8 percent number, find out how much of it is dunning you haven’t set up yet.
Why the benchmark is the wrong target (and net revenue retention is the right one)
Hitting the industry average isn’t the goal. Matching a benchmark just means you’re average at leaking. The real goal is a system where retention compounds, where the customers you keep spend more over time. That’s what net revenue retention measures, and it’s the number that actually tracks growth.
NRR captures the whole picture: what you keep, what you lose, and what existing customers expand into. A company can have respectable logo churn and still be quietly dying if its remaining accounts shrink. It can have ordinary churn and still compound beautifully if its keepers expand. The math here isn’t subtle.
Median private B2B SaaS net revenue retention is near 101 percent, and top-quartile companies report 118 to 120 percent, with what the researchers call a strong and exponential correlation between NRR and growth, per SaaS Capital’s 2025 retention research. Exponential. A retention fix isn’t a defensive move. It’s the single biggest growth move you have.
You don’t have to take my framing for it. Here’s Nick Mehta, CEO of Gainsight, the company that created the customer-success category, in his McKinsey interview:
“net retention, as much as almost any other factor, right alongside growth rate, is one of the biggest drivers of shareholder value.”
So when you stop chasing the benchmark and start moving NRR, you’re not playing defense. You’re pulling the same lever the highest-value SaaS companies pull.
Let me make this concrete with the diagnostic I run. The Churn Decomposition Read is three lines you can run on your own number this afternoon:
1. Which churn is this? Revenue or logo. (Pick one and stay consistent.)
2. How much is involuntary? Total churn minus voluntary equals recoverable billing failure.
3. Which journey stage does the remaining real churn trace back to? (Usually the first win.)
I once worked with an enterprise B2B SaaS company that was convinced it had a growth problem. The instinct was to spend more on acquisition. We ran the read. Once we separated the recoverable billing churn and located the rest, the real churn traced almost entirely to one place: customers were signing and then never reaching the moment that made the product feel worth keeping.
Chasing leads had done nothing, because leads weren’t the constraint. We named and instrumented the first-win moment for one cohort, and net revenue retention started to move. The diagnostic frame I gave them is the one I’ll give you: you don’t have a growth problem.
You have a retention problem that’s costing you growth. And the decision behind that problem, whether to bring in a fractional CMO for B2B SaaS to own the system, is a different question for a different day.
How do you find the one retention constraint behind your churn number?
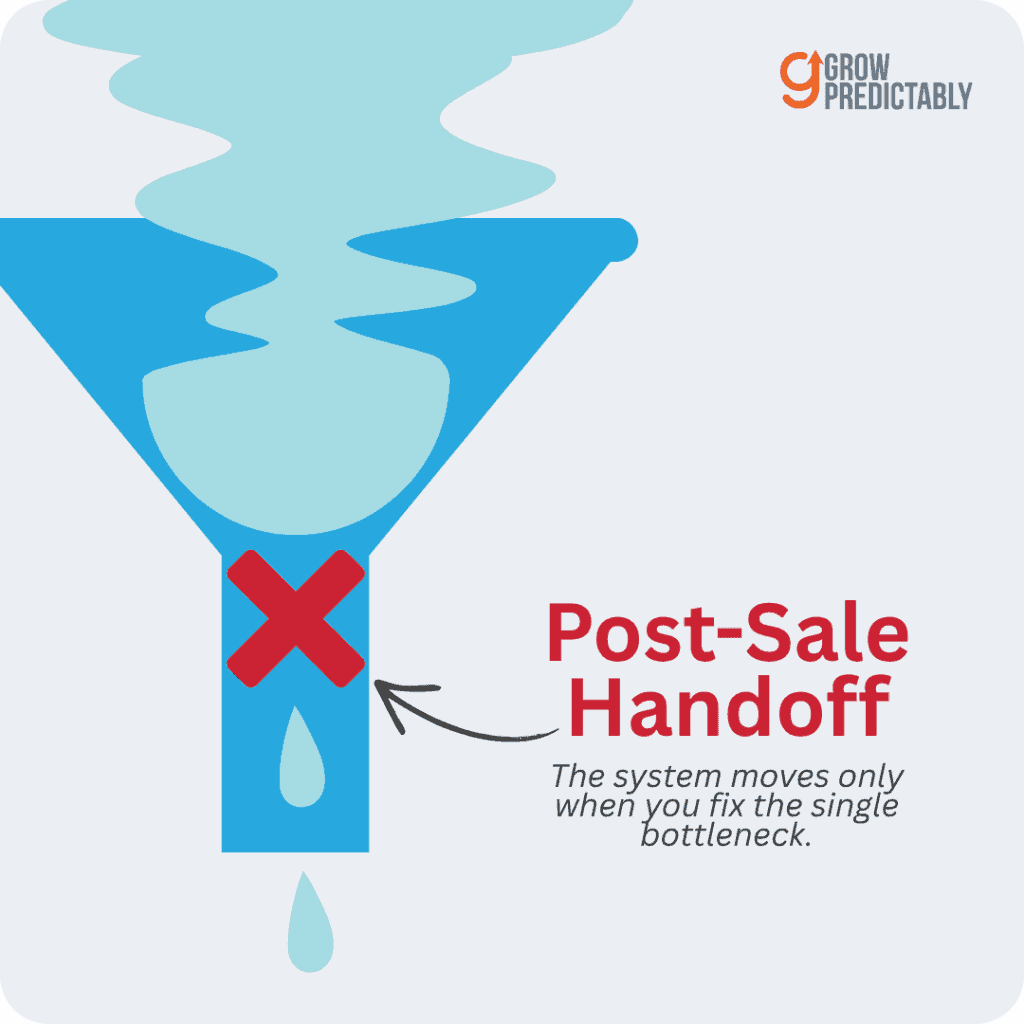
You find it by accepting that there’s usually one. A system is held back by a single bottleneck at a time (this is the core of Goldratt’s Theory of Constraints), and you only speed the whole thing up by fixing that one spot. Everything else is a non-constraint with spare capacity.
Pour effort into a non-constraint and you just create buildup, not flow. Your churn number is pointing at the bottleneck. Your job is to locate it.
The post-sale handoff is where most churn is born
In B2B SaaS, the constraint almost always lives in the handoff between the buying decision and the first real win. It’s the most critical window in the entire relationship, the moment a customer crosses from prospect to buyer and waits to find out if the promise was real.
Get them to a genuine first win and they stay. Leave them stranded in setup and they drift, then cancel, and you log it as churn months later without ever seeing the cause. As I tell every founder: great onboarding can’t fix a broken promise, but a clear first win delivered fast can carry an ordinary one a long way.
The activation data backs this up. Average SaaS activation sits near 37.5 percent in 2025, per PayPro Global’s 2025 benchmarks, which means most users never reach the moment that makes the product stick, and weak activation is the upstream driver of early churn.
A 30-minute self-diagnosis
Walk it as a chain. High churn is the symptom. No engineered first-win moment is the root cause. Defining and instrumenting that one moment is the intervention. So pull one cohort, say everyone who signed up last quarter, and ask three things.
What’s the specific first win this product delivers? How many of that cohort actually reached it, and how fast? Where exactly did the ones who churned stall out? You’ll usually find a single stage where people pile up. That’s your constraint.
Naming the constraint is the work this piece owns. Building the fix, the actual flows that engineer the first 48 to 72 hours of onboarding, is the next move, and it lives in the onboarding playbook so I won’t rebuild it here. If the harder question is who should own this work, a contractor or a long-term operator, that’s covered in the case for a growth partner rather than an agency.
What should you do this week if your churn is above benchmark?
Don’t boil the ocean. The temptation is to launch six retention tactics at once, and that’s just pouring effort into non-constraints. One move this week. Run the Churn Decomposition Read on your number, strip out the involuntary billing churn first, then pick one cohort and find the single stage where real churn is born.
That’s it. Name the one constraint before you touch anything else.
And resist the reflex that breaks most teams: spending the next quarter buying more leads to outrun the churn. That pours water into a leaking bucket. It also optimizes a non-constraint, so it can’t speed up the system no matter how much you spend.
Remember the math: NRR and growth are exponentially correlated, so fixing the leak is the growth play, not the consolation prize.
One honesty note on the timeline. A retention fix shows up on a 60 to 90 day cohort arc, not on next week’s dashboard. Name the decision now so you can claim the progress, then give the cohort time to prove it.
Where do you start?
Start with the read, not the panic. Today, before you green-light a single new campaign, run the Churn Decomposition Read on your own number: separate revenue from logo, strip out the involuntary billing churn, and trace the real churn that’s left back to one journey stage. That one pass will usually turn a vague, scary 8 percent into a single named constraint, almost always sitting in the gap between the sale and the first win.
Once you can see the one thing, you stop spending against the whole funnel and start fixing the part that’s actually leaking. If you want a faster, structured way to surface that constraint across your whole growth system, run the scan.
About the author
Brian helps B2B founders install marketing + automation engines powered by Co-Thinking with AI. With 15+ years building predictable revenue systems, he's worked with SaaS, agency, and service businesses on 90-day done-with-you growth accelerators.
Ready to install your predictable revenue engine?
Book a free strategic growth session. Walk away with a tailored 90-day blueprint and 3 quick wins you can use this week.