B2B SaaS Marketing Statistics for 2026: Numbers That Survive a Source Check

Founder, Grow Predictably · 15+ yrs building B2B revenue systems
TL;DR: B2B SaaS marketing statistics are worth using in 2026 only when they name their population. That means who answered, how many, and when. Benchmarkit found a median new customer CAC ratio of $2.00 per $1.00 of new ARR among participating B2B SaaS companies. A statistic becomes defensible only when its population matches the company using it, not when it sounds impressive in a slide.
Key Takeaways
- Benchmarkit’s 2025 B2B SaaS Performance Metrics Benchmarks found a median new customer CAC ratio of $2.00 per $1.00 of new ARR among participating B2B SaaS companies (source).
- Gartner’s 2026 CMO Spend Survey of 401 marketing leaders put average marketing budgets at 7.8% of company revenue. It is a cross-industry figure, not a B2B SaaS one (source).
- Gartner found that 67% of 646 B2B buyers prefer a rep-free experience. In the same survey, 45% used AI during a recent purchase (source).
- In G2’s vendor-published survey of 1,076 B2B software buyers and decision-makers, 51% now start research with an AI chatbot more often than with Google (source).
- A five-question source check separates a defensible B2B SaaS marketing statistic from one that will not survive a boardroom question.
A B2B SaaS marketing statistic looks the same whether it came from a named survey or from a blog post that copied another blog post. That is the problem. The previous version of this page listed 28 such numbers. Several had already expired, and none stated who was surveyed.
This guide replaces that list with eight current findings. Each one carries who answered, how many, and when. It also gives the five-question check a B2B SaaS marketing leader can run before a number goes into a plan or a board deck.
It is written for the founder, CMO, or VP of Marketing building next quarter’s budget. That reader does not want to defend a statistic that turns out to describe a different industry, a different year, or a vendor’s own customer list. The diagnostic view here treats a number as useful only once its population is known.
Which B2B SaaS marketing statistics are worth using in 2026?
The B2B SaaS marketing statistics worth using in 2026 name their own population: who was surveyed, how many, when, and who published the number. The findings below meet that bar, from sales and marketing spend to buyer research to market size.
Each one links to its primary source, so a reader can verify it directly.
| Figure | Who was asked | How many | When | Publisher |
|---|---|---|---|---|
| Median new customer CAC ratio: $2.00 per $1.00 of new ARR | Participating B2B SaaS companies | 73 companies reported this metric | 2024 data | Benchmarkit (via HiBob) |
| Marketing budgets at 9.0% of revenue | Marketing leaders at for-profit U.S. companies | 308 respondents | Fielded January 7 to 29, 2026 | The CMO Survey |
| Marketing budgets at 7.8% of company revenue | CMOs and marketing leaders in North America, the UK and Europe, the vast majority over $1 billion in revenue | 401 leaders | January to March 2026 | Gartner |
| 67% of B2B buyers prefer a rep-free experience | B2B buyers | 646 buyers | August to September 2025 | Gartner |
| 51% of B2B software buyers now start research with an AI chatbot more often than Google | B2B software buyers and decision-makers | 1,076 buyers | March 2026 | G2 (vendor-published) |
| Link clicks in 8% of visits with an AI summary, 15% without one | U.S. adults, all Google searches | 900 adults | March 2025 | Pew Research Center |
| 87% of AI-for-content users say productivity has improved | B2B marketers using AI for content creation (a subgroup) | 1,015 B2B marketers in the survey base | Fielded June 24 to August 14, 2025 | Content Marketing Institute and MarketingProfs |
| Cloud Application Services (SaaS) end-user spending forecast: $299.1 billion in 2025 | Worldwide end-user spending, modelled | Not a survey | Forecast published November 2024 | Gartner |
| B2B SaaS market estimate: $390 billion in 2025 | Mordor Intelligence’s own B2B SaaS market definition, modelled | Not a survey | Estimate for 2025 | Mordor Intelligence |
Each statistic below is detailed with its full source in the sections that follow. For the broader strategy these numbers support, see the broader B2B SaaS marketing playbook these statistics feed into.
Why do B2B SaaS marketing statistics mislead when the population is missing?
B2B SaaS marketing statistics mislead when the number moves without its population. Ask what percent of revenue goes to marketing, and two surveys give three answers. Gartner says 7.8%. The CMO Survey says 9.0% overall, and 7.0% for its B2B product companies.
Neither survey is limited to B2B SaaS companies.
The symptom shows up in the boardroom. A plan cites a marketing-spend figure, and two sources disagree by more than a point of revenue. The root cause is not that one survey is wrong. Instead, the figure moved without its population, so nobody in the room can say which survey the company resembles.
Here is why the answers differ. Who was asked:
- Gartner’s 7.8%: 401 CMOs and other marketing leaders in North America, the United Kingdom and Europe, surveyed January through March 2026. The vast majority report annual revenue over $1 billion.
- The CMO Survey’s 9.0%: 308 marketing leaders at for-profit U.S. companies, surveyed January 7 to 29, 2026. Its 7.0% covers only the B2B product companies in that sample.
So a B2B SaaS leader using any of these figures is comparing against a population it may not resemble.
The same pattern appears outside budget data. Pew Research Center’s click-rate finding describes 900 U.S. adults and all of their Google searches, not B2B buyers. Using it to argue about B2B SaaS buyers applies a consumer population to a business claim.
The fix is to keep the population next to the number, every time. The anti-pattern is adding more statistics to make a plan look thorough. A longer list of unchecked figures raises the odds that one fails in front of a CFO.
How do you check a B2B SaaS marketing statistic before you use it?
Checking a B2B SaaS marketing statistic means running it through five questions before it goes into a plan. Who was asked, how many and when, which subgroup answered, what the source says word for word, and who published it. A number that cannot answer all five should not go into a board deck.
| Question | What to look for in the source | Red flag |
|---|---|---|
| Who was asked? | The population named in the source’s own words | The claim names no population at all |
| How many, where and when? | A sample size, a region, and field dates | No sample size or date anywhere in the source |
| Which subgroup answered this question? | Whether the figure covers every respondent or only a subset | A subset result is presented as if everyone answered it |
| What does the source say, word for word? | The source’s own verb: prefer, plan to, estimate, median | A paraphrase swaps in a stronger verb than the source used |
| Who published it, and what do they sell? | Independent research, an analyst firm, or a vendor describing its own market | A vendor’s own research is presented as independent |
An earlier version of this page claimed that public SaaS organizations between one and three years old spend 80% to 120% of revenue on marketing and sales. The only source cited was an agency blog roundup, with no primary research behind it.
Run through the five questions, it fails every one. It names no surveyed population, gives no sample size or date, and names no subgroup. There is no source wording to compare, and the publisher was an agency roundup rather than the research itself.
The same discipline applies to a company’s own numbers, not just outside sources. At a B2B software company where I worked, organic traffic to a set of go-to-market web pages grew 23% year over year in the first half of 2025. That beat a 20% stretch goal. Organic impressions for the same pages grew 14%, just below a 15% goal.
The number that mattered there was not an industry benchmark. It was the company’s own baseline and its own goal, checked against each other before any outside comparison entered the conversation.
What do B2B SaaS companies spend on sales and marketing, and what does it buy?
B2B SaaS companies in Benchmarkit’s 2025 B2B SaaS Performance Metrics Benchmarks reported sales and marketing operating expense at 37% of revenue at the median. The median new customer CAC ratio was $2.00 of sales and marketing expense for every $1.00 of new customer ARR. That ratio rose 14% in 2024.
Who was asked:
- Benchmarkit’s report: 583 participating B2B SaaS companies, reporting 2024 data.
- Sales and marketing expense (37%): the median on the report’s operating-expense chart. That chart prints sample sizes of 157, 142 and 140 without labelling them by function.
- New customer CAC ratio ($2.00): reported by 73 companies.
- Growth rate (26%): reported by 149 companies.
In Benchmarkit’s data, the median growth rate for 2024 was 26%. Top quartile growth fell from 60% in 2023 to 50% in 2024.
Spend also differs by funding source. Benchmarkit found sales and marketing at 47% of revenue for VC-backed companies, against 33% for PE-backed companies.
The report recommends filtering by company size, contract value, pricing model, go-to-market motion, and financial backing. The filter is the same population check this guide applies everywhere. For example, a company spending 25% of revenue is underspending against the 37% median only if it shares the backing, size and motion of the companies behind that median.
For what each metric measures, see a plain-language breakdown of these B2B SaaS marketing metrics.
How big are B2B SaaS marketing budgets compared with other companies?
B2B SaaS marketing budgets are not reported separately by either major cross-industry survey. Gartner’s 2026 CMO Spend Survey put average marketing budgets at 7.8% of company revenue. The CMO Survey put the same figure at 9.0%. Both describe marketing leaders across industries, not B2B SaaS companies specifically.
Who was asked:
- Gartner’s 2026 CMO Spend Survey: 401 CMOs and other marketing leaders in North America, the United Kingdom and Europe, surveyed January through March 2026. The vast majority report annual revenue over $1 billion.
- The CMO Survey: 308 marketing leaders at for-profit U.S. companies, surveyed January 7 to 29, 2026.
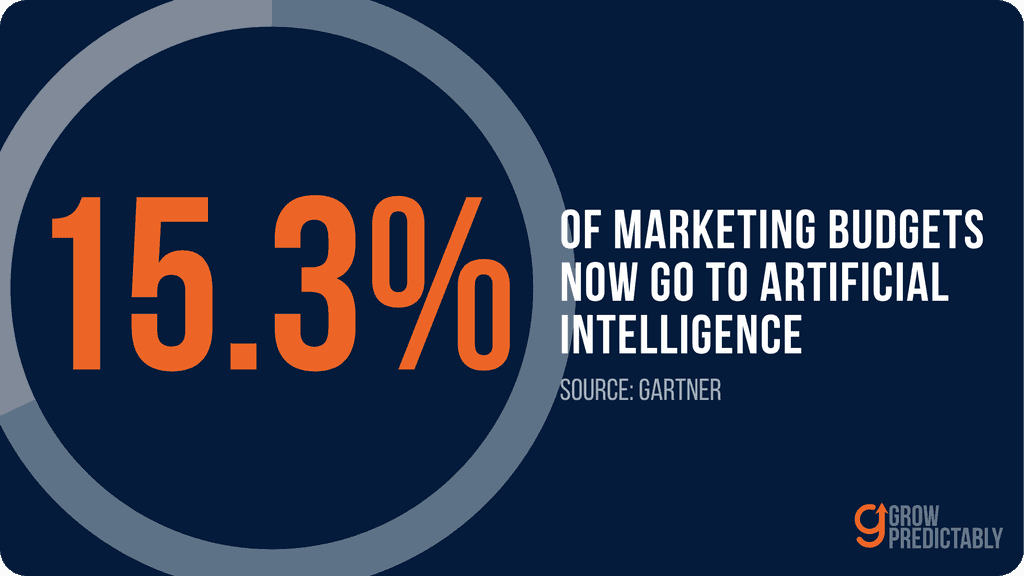
In Gartner’s results, budgets rose slightly to 7.8% of company revenue in 2026, from 7.7% in 2025. On average, 15.3% of marketing budgets went to AI.
Those who succeed will make deliberate, data-driven trade-offs and treat AI as a force multiplier.
Ewan McIntyre, VP Analyst and Chief of Research in the Gartner Marketing practice, in Gartner’s 2026 CMO Spend Survey release
The CMO Survey put marketing budgets at 9.0% of revenue overall. Within the same sample, B2B product companies spent 7.0% of revenue and B2B services companies 10.1%.
Neither survey isolates B2B SaaS companies, so either figure is a cross-industry reference point. The diagnostic view this guide uses compares a company’s own prior-year spend first. Only then does it bring in the outside figure whose population comes closest.
For where that spend should go, see a framework for deciding where B2B SaaS marketing spend should go.
How do B2B buyers research software before they talk to a B2B SaaS vendor?
Two separate surveys describe how B2B buyers research purchases and software today. Gartner found 67% of B2B buyers prefer a rep-free experience. In G2’s own research, 51% of B2B software buyers and decision-makers now start research with an AI chatbot more often than with Google.
Who was asked:
- Gartner: 646 B2B buyers, surveyed August through September 2025. The release does not state a region.
- G2 (vendor research): 1,076 B2B software buyers and decision-makers, surveyed in March 2026. G2 sells to software companies. The post does not state a region.
- Pew Research Center: 900 U.S. adults who are members of KnowledgePanel Digital, covering all of their Google searches in March 2025. These are not B2B buyers.
In Gartner’s survey, the 67% figure is a stated preference for a rep-free experience, not observed behavior. In the same survey, 45% reported using AI during a recent purchase.
In G2’s research, beyond the 51% who start in an AI chatbot, 71% rely on one at some point in their research.
In Pew’s data, users who saw an AI summary clicked a traditional search link in 8% of visits. Without one, they clicked in 15% of visits. That is consumer search behavior, not B2B software research.
Barbara Winters, vice president and principal analyst at Forrester, said in Forrester’s release on The State Of Business Buying, 2026 that providers must demonstrate deep understanding of buyer needs, ensure their claims can be validated through trusted external voices, and design trial experiences that prove long-term business value.
A B2B SaaS marketing team adjusting to rep-free, AI-assisted research needs different levers than one optimizing a search-click funnel. See how that shift changes what a B2B SaaS marketing team builds for self-directed buyers.
What do B2B SaaS content marketing statistics say about AI and measurement?
B2B SaaS content marketing statistics on AI show a gap between productivity and proof. Among B2B marketers using AI for content creation, the Content Marketing Institute and MarketingProfs found 87% say productivity has improved, but 39% say content performance has.
Across all respondents, 33% name measuring content effectiveness a top-three challenge.
Who was asked:
- CMI and MarketingProfs, B2B Content and Marketing Trends: Insights for 2026: 1,015 B2B marketers, mostly from North America, surveyed June 24 to August 14, 2025. They were drawn from 1,229 global responses. Industries include technology (25%), agency (21%) and consulting (11%). The survey is not limited to B2B SaaS companies.
The three figures describe two different groups:
- 87% say productivity has improved (marketers using AI for content creation only).
- 39% say content performance has improved (the same subgroup).
- 33% chose measuring content effectiveness as a top-three challenge (all B2B marketers surveyed).
The diagnostic view this guide uses reads these figures together. A productivity statistic and a performance statistic are two different claims, so a gain in one is not evidence of a gain in the other.
For how this same AI shift shows up in search visibility rather than content workflow, see visibility inside AI-generated answers for B2B SaaS companies.
How big is the B2B SaaS market, and why do the estimates disagree?
B2B SaaS market size estimates disagree because they measure different things with different methods. Gartner forecast worldwide end-user spending on its Cloud Application Services (SaaS) category at $299.1 billion for 2025.
Mordor Intelligence, a separate commercial research firm, estimated the B2B SaaS market specifically at $390 billion for the same year.
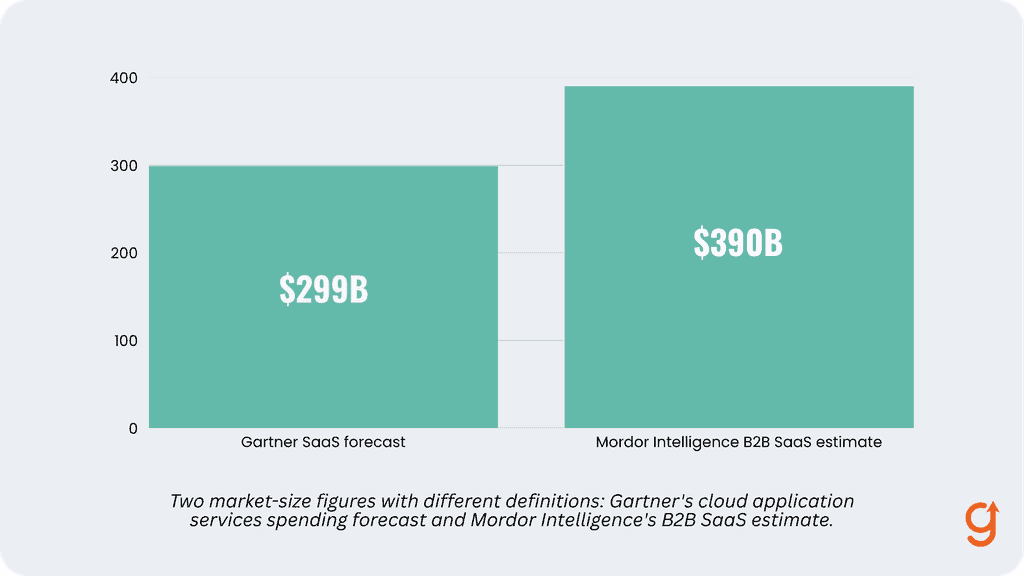
Gartner’s November 2024 forecast covers worldwide end-user spending on what it labels Cloud Application Services (SaaS). It forecasts $299.1 billion in 2025. That sits inside a total public cloud forecast of $723.4 billion. Mordor Intelligence’s B2B SaaS market report values the market at $390 billion in 2025.
It projects $492.34 billion in 2026 and $1,578.2 billion by 2031.
Both figures are modelled estimates, not counts of actual transactions. They also use different scopes. Gartner’s category covers all cloud application services spending worldwide. Mordor’s defines a B2B SaaS market on its own terms.
Neither source resolves the gap, and this guide does not reconcile them. A market-size statistic answers a market question, not a company’s own spend or growth question. The two should never substitute for each other in a plan.
Where should a B2B SaaS team start with these statistics this quarter?
A B2B SaaS team should start this quarter by comparing its own numbers against its own prior baseline and goal. Only after that comparison does an outside statistic, population matched, become useful context rather than decoration. None of the eight figures above is a target for any single B2B SaaS company.
Each describes a different population, at a different time, for a different purpose. The diagnostic view this guide uses treats a company’s own trend as the first comparison. An outside benchmark, population matched, comes second. For retention numbers specifically, see retention and churn benchmarks for B2B SaaS companies.
The fastest way to find where a B2B SaaS marketing plan is actually constrained, rather than guessed from a borrowed statistic, is to take the Growth Gap Scan.
Frequently Asked Questions
What percentage of revenue should a B2B SaaS company spend on marketing?
There is no single percentage every B2B SaaS company should spend, because no major survey isolates B2B SaaS marketing budgets specifically. Benchmarkit’s 2025 B2B SaaS Performance Metrics Benchmarks found sales and marketing operating expense at 37% of revenue at the median among participating B2B SaaS companies, based on 2024 data from 157 companies. Cross-industry surveys put overall marketing budgets at 7.8% (Gartner) and 9.0% (The CMO Survey) of revenue, but neither survey is limited to SaaS companies.
What is a good CAC ratio for B2B SaaS?
A good new customer CAC ratio for B2B SaaS, per Benchmarkit’s 2025 B2B SaaS Performance Metrics Benchmarks, sits near the reported median of $2.00 of sales and marketing expense for every $1.00 of new customer ARR, based on 73 participating B2B SaaS companies in 2024 data. That ratio rose 14% in 2024. Benchmarkit recommends filtering by company size, pricing model, go-to-market motion, and financial backing before comparing against it.
What is the rule of 40 in SaaS?
The rule of 40 is a SaaS benchmark concept. It holds that a healthy company’s revenue growth rate plus its profit margin should add up to 40% or higher, used as a quick check on whether growth is being bought at an unsustainable cost. This page cites no rule of 40 figure for B2B SaaS, since no source used for this article reports one. Compare your own growth rate and margin against last year first.
Where do reliable B2B SaaS marketing statistics come from?
Reliable B2B SaaS marketing statistics come from named surveys that publish their own population. Independent research, such as the CMO Survey, Gartner, Pew Research Center, and Benchmarkit, states its sample size and field dates in the source itself. Vendor-published research, such as G2’s buyer survey, can still carry useful figures but should be labeled as the vendor’s own research rather than independent research, since the vendor sells to the audience it surveyed.
How often should B2B SaaS marketing statistics be updated?
B2B SaaS marketing statistics should be checked against their publisher’s newest release before use in a current plan, since the surveys behind them run on different schedules. The CMO Survey and Gartner’s CMO Spend Survey are fielded in the first few months of each year. Benchmarkit’s B2B SaaS Performance Metrics Benchmarks report covers the prior calendar year’s data. A figure from an earlier survey cycle should be re-verified against the publisher’s current edition before it goes into a plan.
Are vendor-published statistics trustworthy?
Vendor-published statistics are not automatically untrustworthy, but they should be labeled as the vendor’s own research rather than independent research. G2’s survey of 1,076 B2B software buyers is vendor-published, since G2 is a software review marketplace that sells services to the same software vendors its survey describes. The same source check applied to any statistic, who was asked, how many, and who published it, applies to vendor data as much as to independent analyst surveys.
About the author
Ready to see your real growth gap?
Two minutes in the Growth Gap Scan and you walk away knowing the one thing capping your pipeline. Free, no obligation.