
Why The ‘More Content’ Type of B2B SaaS Content Marketing Kills Pipeline Past 5M ARR

TL;DR
B2B SaaS content marketing is the practice of producing buyer-intent content that moves prospects through the Customer Value Journey (CVJ), from Aware to Promote. Diagnose-first content marketing fixes the real problem most SaaS teams face. The content that wins in B2B SaaS isn’t more content. It’s the right content concentrated at the CVJ stage that’s actually capping pipeline.
KEY TAKEAWAYS
- Only 29% of SaaS marketers consider their content strategy very effective, according to RevenueZen, which signals an alignment failure rather than a volume problem.
- The average B2B SaaS website converts 2.3% of visitors to leads while top performers exceed 10%, per Oliver Munro, and that gap won’t close by publishing more posts.
- The Customer Value Journey is the diagnostic frame this article uses to locate the binding constraint across eight buyer stages, so you can route content investment to where it actually moves pipeline.
- Diagnose-first content marketing finds the binding constraint in your CVJ before you brief a single new piece, treating content like a doctor treats a patient.
- Strong buyer personas and clear buyer intent at each CVJ stage matter more than raw traffic generation, because fit-for-engagement leads come from stage-targeted content, not broader reach.
B2B SaaS content marketing in 2026 is the discipline of diagnosing which Customer Value Journey stage your existing content is failing to serve before commissioning the next piece, not running a topic-cluster cadence as if coverage breadth is the leverage.
The content that wins B2B SaaS isn’t more content; it’s the right content concentrated at the CVJ stage that’s actually capping pipeline, where investment in non-constraint stages produces volume the system can’t convert.
This is the operator view of B2B SaaS content marketing for founders, CMOs, and Heads of Content scaling from $5M to $50M ARR. The standard advice, produce more content, build out the editorial calendar, ship case studies and ebooks across every funnel stage, is the prescription a pharmacist hands out without an exam. The work below is the diagnostic.
What is B2B SaaS content marketing that produces fit-for-engagement leads?
B2B SaaS content marketing that produces fit-for-engagement leads is content deliberately mapped to a specific Customer Value Journey stage where your pipeline actually stalls, not content produced for volume or awareness. The lever isn’t more content. It’s content concentrated at the one stage your buyer can’t get past.
Volume vs. Stage-Specific Content: The Core Distinction
Most B2B SaaS teams I work with run their content strategy as a coverage exercise. Blog posts here, webinars there, founder-led content on LinkedIn, gated assets in the sequence, video across marketing channels. The dashboard looks busy. Pipeline stays flat.
That’s the gap between volume and stage-alignment. The data backs it. According to the State of Data-Driven Content Marketing 2026 report, 88% of data-driven content teams report positive ROI and 64% drive higher conversion rates. Those numbers diverge sharply from the SaaS average, and the difference isn’t budget.
It’s whether the content writing is tied to a defined stage transition or just filling slots on a calendar.
This compounds. The Averi guide to content marketing ROI benchmarks for B2B SaaS puts it plainly: content marketing delivers long-term ROI for B2B SaaS companies because returns accumulate over time, while paid ads stop generating leads the moment the budget runs out. Stage-mapped content keeps working.
What ‘Fit-for-Engagement’ Actually Means in a B2B SaaS Pipeline
Fit-for-engagement isn’t a synonym for qualified leads in the MQL sense. It means the prospect is at the exact stage your offer is built to move them through, and the next conversation will land. Across the SaaS teams I’ve worked with, the content that produces those leads has one thing in common. It moves a buyer through a single stage transition. It isn’t built to attract traffic at the top.
The CVJ framework treats this as an engineering problem. Eight stages, one binding constraint at a time, investment routed to the stage actually capping pipeline. Most content marketing agencies and most content marketing tools optimize for volume metrics because that’s what’s easiest to instrument.
Your marketing strategy needs the opposite. Fewer pieces. Each one tied to a specific stage transition. Each one measured by whether buyers move.
How do you diagnose which CVJ stage your content is failing to serve?
Map every existing piece to one of the eight Customer Value Journey stages based on actual buyer intent, then trace your last 30 closed-won and closed-lost deals through their first content touchpoints. The stage where touchpoint volume is high but piece count is thin is your binding constraint — that’s the stage starving your pipeline.
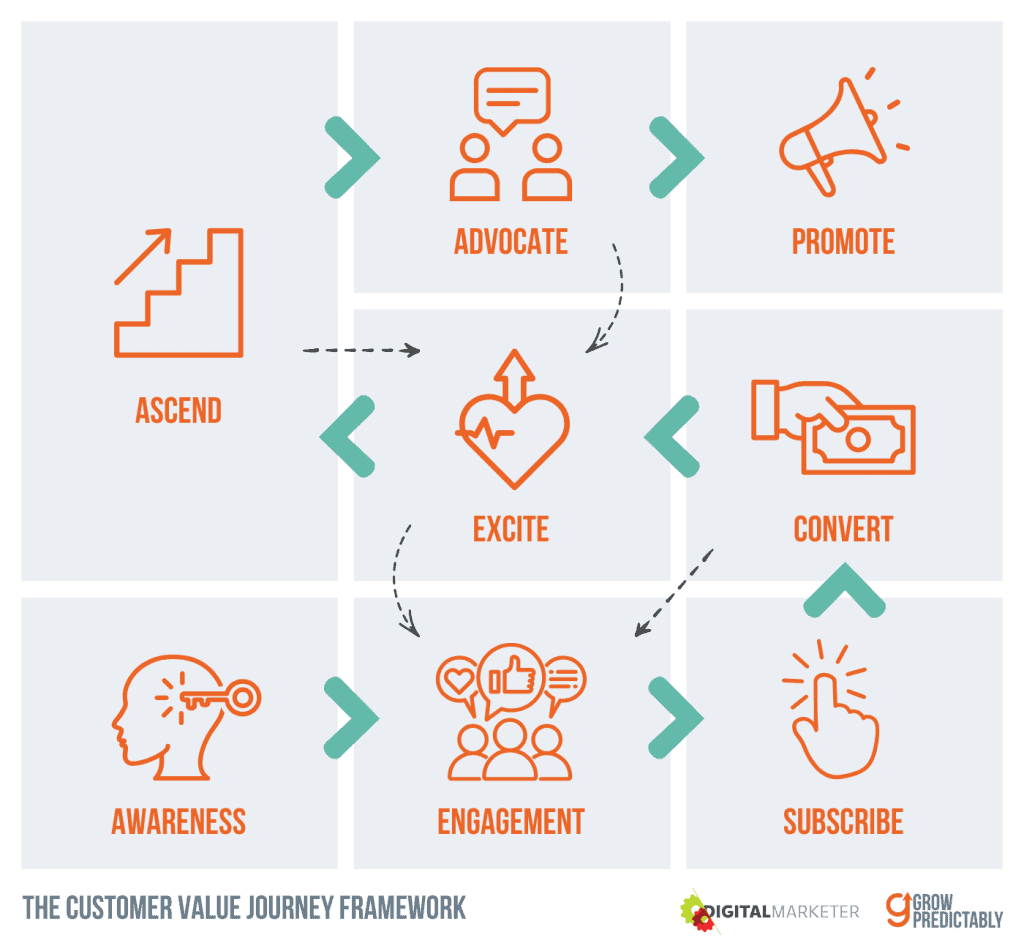
Mapping Your Existing Content to Each CVJ Stage
The eight stages — Aware, Engage, Subscribe, Convert, Excite, Ascend, Advocate, Promote — each serve a distinct job in the buyer’s progression. A constraint at any single stage caps the full pipeline, regardless of how much volume you produce elsewhere. Tag every URL to the stage your target audience actually treats it as, not the stage you intended when you commissioned it.
A vendor-comparison piece is Convert-stage even if your editorial calendar files it under Engage.
Identifying the Drop-Off: Where the Pipeline Actually Stalls
Once content is mapped, the coverage shape usually reveals the misallocation before you touch a CRM record. Most teams I’ve worked with land 60-80% of their pieces at Aware and Engage and almost nothing at Convert or Excite — the stages where qualified prospects stall and where fit-for-engagement leads are actually produced. I’ve watched teams pour quarters of effort into top-of-funnel volume, watch traffic climb, and still miss number — because every new asset feeds the wrong stage.
That’s not a content problem. That’s inventory buildup at a non-constraint, dressed up as activity.
The Diagnostic Checklist: Questions to Ask Before Producing Anything New
Before commissioning a single new piece, work through this:
- Which CVJ stage does this piece serve, by buyer intent?
- What’s our current piece count at the binding-constraint stage?
- Do our closed-won touchpoints concentrate at a stage where our piece count is thin?
- Are we tracking conversion rates by stage, or just aggregate traffic?
- What customer problems does this piece resolve that nothing in our current library addresses?
Research backs this rhythm: high-performing teams make this kind of diagnostic a monthly ritual, not a quarterly cleanup. Successful copywriting examples in our archive all share one trait — they were commissioned against a named constraint, not a content-calendar slot.
Why does the standard B2B SaaS content advice fail past $5M ARR?
The standard playbook (publish more, rank for more keywords, repurpose across channels) stops producing pipeline lift past $5M ARR because it pours investment into stages that already have excess capacity. The binding constraint has migrated downstream. Adding fuel upstream doesn’t fix it, and the data is starting to show what most marketing leaders already feel privately.
The Standard Playbook and Where It Breaks
At $1M to $3M ARR, the playbook works. Brand awareness is the actual gap, so high-volume top-of-funnel content (the Animalz-style blueprint, the Tofu engine, the keyword cluster) creates real lift. You publish, you rank, you see qualified pipeline grow, and the cause-and-effect feels obvious.
Past $5M, that same engine starts misfiring. According to RevenueZen, only 29% of SaaS marketers consider their content marketing strategy very effective, even as budgets climb. 5W PR’s SaaS Content Paradox research frames it more bluntly: B2B software companies are spending more on content than at any point in the industry’s history, and most marketing leaders quietly admit the returns are disappointing.
The reason is structural, not tactical. By the time you’ve shipped 18 months of content, awareness is rarely the binding stage anymore. The leak has moved to Convert, Excite, or Ascend on the Customer Value Journey, and more top-of-funnel work can’t reach it.
Why More Content Spend Produces Diminishing Returns After Early Traction
In my work across B2B SaaS teams, I’ve watched this pattern play out again and again: growth flattens, the instinct is to push harder on traffic and SQLs, and the real constraint is post-conversion. Growth problems disguise themselves as content problems. Most of the time, they’re retention or conversion problems in disguise.
The mechanism is simple. Non-constraints have excess capacity by definition. Pouring more content into a non-constraint stage moves the metric on that stage and nothing further down. Your traffic chart climbs, your funnel chart doesn’t.
What does diagnose-first content marketing look like in practice for a B2B SaaS team?
Diagnose-first content marketing starts with a CVJ-stage audit of your existing library before anyone touches a keyword list or editorial calendar. You map every asset to a Customer Value Journey stage, find the stage where pipeline drops off, and route the next quarter of production to close that single gap. The audit is the diagnosis. Production is the prescription.
In practice, the first session I run with a SaaS team almost always starts with the same exercise. We pull every blog post, gated asset, and video into a spreadsheet and tag each one to a CVJ stage. Then we overlay pipeline data.
Within a few hours, the constraint stage is usually obvious, and it’s almost never the stage the team thought they had a problem at.
| Step | Description |
|---|---|
| Step 1: Audit Content Against CVJ Stages | The audit is a sorting exercise, not a quality review. Tag each asset to the CVJ stage it actually serves based on who reads it and what they’re trying to do. Then count assets per stage. Most B2B SaaS libraries cluster heavily at Aware and Engage, with almost nothing at Convert or Excite — that gap is your binding constraint. |
| Step 2: Route Production to the Constraint Stage | Once you’ve named the constraint, concentrate the next quarter’s calendar there. If Convert is the gap, every new asset becomes conversion-focused and written for buyers already comparing vendors. Lead generation improves because production serves the stage where pipeline forms. Repurposing helps: Series X Marketing finds repurposing existing content improves ROI by ~32%, so reframing an Aware-stage post for Convert often outperforms a brand-new piece. |
| Step 3: Use Pain-Point Content Architecture to Fill the Gap | Use the Tech Content Engine framework to shape production. Build each Convert-stage asset around a specific customer pain point, in the customers’ language, rather than around features or search-volume targets. Shifting from feature-led to customer-language pain-point posts raises engagement and inbound trust (example: work with a B2B SaaS founder). Publishers like Siege Media use customer-language research as the input for every brief. If needed, use the author’s B2B content strategy for AI-search visibility as a structural starting point. |
How do you measure whether your content is producing leverage or just volume?
Three measurements tell you whether your content is moving sales pipeline or just inflating a content library. Track stage-transition rates at the binding CVJ stage. Track pipeline-attributed conversion against the visitor-to-lead benchmark.
Track how much of your investment is concentrated at the diagnosed constraint. Everything else is activity.
According to Genesys Growth’s content marketing ROI research, stage-aligned content compounds to roughly 3x returns over time, but only when investment routes to the stage that’s actually capping pipeline rather than spreading evenly across the funnel. That gap between average and 3x performance isn’t a budget gap or a publishing-cadence gap.
It’s a measurement gap. Teams that watch stage-transition rate instead of traffic volume see the compounding because they’re spending against the constraint, not the calendar. The 3x return is the math behind why pipeline-attributed conversion at the binding CVJ stage is the only volume metric worth tracking weekly.
Stage-Transition Metrics vs. Vanity Volume Metrics
Posts per month, total traffic, keyword rankings. These are proxy numbers that move without your sales pipeline moving with them. They show that work happened. They don’t show whether the work removed the constraint.
The gap between average and top-performing teams is the cleanest signal here. According to Oliver Munro’s SaaS benchmark report, the average B2B SaaS website converts 2.3% of visitors to leads, while top performers exceed 10%. That four-times spread isn’t a volume gap.
The top teams aren’t publishing four times more. They’re publishing content concentrated at the stage where buyers actually decide, which is what turns traffic into fit-for-engagement leads.
This is also why diagnostic discipline beats dashboard discipline. As Datalily’s State of Data-Driven Content Marketing report found, data-driven teams are 61% more likely to see better organic rankings and 51% more likely to have greater content engagement. The teams winning that gap aren’t measuring more things.
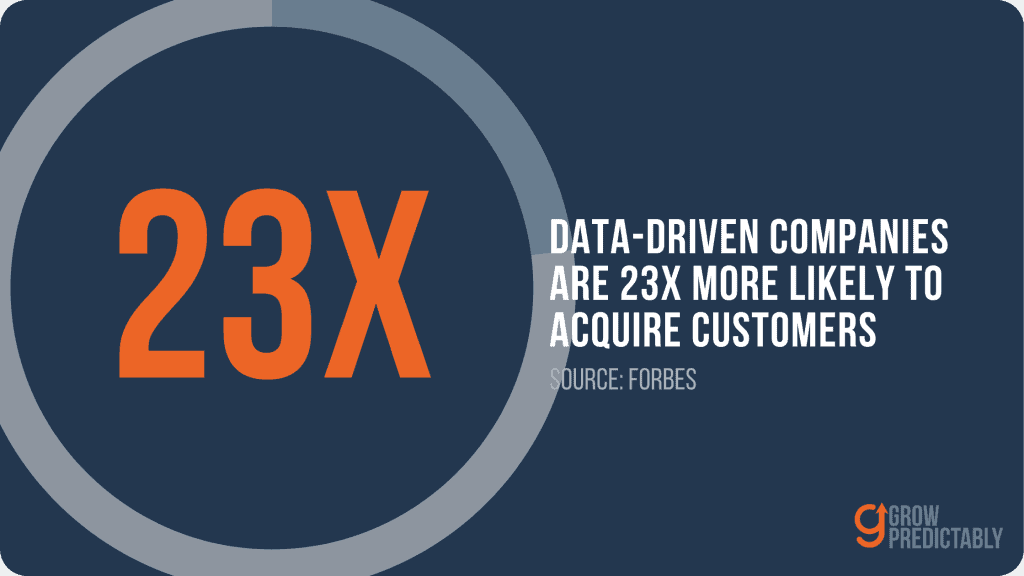
They’re measuring the right things at the stage where customer acquisition actually breaks.
The Measurement Stack for a Diagnose-First Content Program
The measurement shift I recommend to every SaaS content team I work with is this: pick the one CVJ stage where your conversion rate is below benchmark, then measure every piece you ship at that stage against the transition rate, not the traffic. If you publish ten pieces this quarter and only two land at the diagnosed constraint, your investment ratio is the problem before the content is.
Watch the stage transition. The volume metrics will sort themselves out, the way Omniscient Digital and other operator-led shops have shown when they shift measurement to where pipeline actually breaks.
What’s the planning shift that turns content marketing into a constraint-diagnostic discipline?
The one planning change that produces the biggest shift from volume to leverage is replacing ‘What content should we produce this quarter?’ with ‘Which CVJ stage is capping our pipeline, and what content removes that constraint?’
The first question optimizes for output. The second optimizes for the place output actually compounds.
Replacing the Editorial Calendar with a Constraint-First Planning Cadence
Most business-to-business content teams I see open the quarter the same way. Someone pulls last quarter’s calendar forward, the channel strategy gets a refresh, and topics are slotted against publishing cadence. The constraint check never happens.
By week two, the team is producing what’s familiar instead of what’s needed.
The shift is to make the diagnostic the first agenda item, not the last. Before any topic gets assigned, the planning meeting answers one question: where in the Customer Value Journey is conversion falling below benchmark? That’s the binding constraint. Every piece in the quarter then earns its slot against that single test.
This matters because attempting to drive more traffic at a non-constraint stage just buries the constraint deeper. You build inventory the funnel can’t process. When I shift a team’s planning question from ‘what should we publish’ to ‘where is pipeline breaking,’ the editorial calendar starts looking different within one cycle.
Fewer topics, more concentration, faster diagnostics.
How the Growth Gap Marketing Framework Anchors the Shift
Growth Gap Marketing is the planning architecture I use to lock this in. It moves a team from reactive volume generation to proactive constraint identification, which is what turns content from a coverage cost into a predictable revenue lever — the same logic operator-led shops like Grow and Convert apply to their own programs.
The cadence change matters as much as the framework. According to Datalily’s State of Data-Driven Content Marketing report, high-performing content teams treat research as a monthly ritual, not a quarterly or annual one. If your constraint check happens once a year, you’re planning against last year’s funnel.
How do you start running diagnose-first content marketing this quarter?
Start with a one-time audit, not a new editorial calendar. Map every asset from the last 60 days to a Customer Value Journey stage, compare the distribution against pipeline drop-off, then rebuild Q+1 so 50-70% of your investment lands at the single stage that’s capping pipeline.
Week 1: Run the CVJ Content Audit
List every published piece and tag it to one of the eight CVJ stages by buyer intent, not editorial intent. The framework I use with software companies scaling from $5M to $50M ARR walks the asset list against Aware, Engage, Subscribe, Convert, Excite, Ascend, Advocate, and Promote.
If you don’t have stage-level pipeline drop-off data yet, use the benchmark from Oliver Munro’s 2026 SaaS report: the average B2B SaaS site converts 2.3% of visitors to leads, while top performers exceed 10%. A wide gap there is your signal that the Engage-to-Subscribe transition is the likely constraint, even before you instrument anything.
Week 2-4: Build the Constraint-Focused Calendar
Once the binding stage is named, route 50-70% of next quarter’s copywriting hours there. Mix net-new constraint-stage pieces with repurposed assets you already own. Series X Marketing reports that repurposing content improves ROI by 32% on average, which is why a first constraint-focused quarter shouldn’t be all new production.
Pull strong Aware-stage posts apart and rebuild them as Subscribe-stage offers or Convert-stage proof. This is the audit-first approach underpinning the revenue-focused SEO and content work I run for clients chasing fit-for-engagement leads.
Maintaining Minimum Viable Frequency at Non-Constraint Stages
The teams I’ve seen stall mid-quarter are usually those that go to zero everywhere except the constraint—don’t. Keep one published piece per non-constraint stage per month so the journey stays intact, whether you’re an enterprise platform or a Perceptric-style early-stage tool. That’s the floor.
Everything else compounds at the constraint, and your next 12 pieces stop being editorial guesses.
How is diagnose-first content marketing different from a content calendar built around topic clusters?
A topic-cluster content calendar prescribes coverage breadth — pick the topics where buyers search, write coverage at scale, optimize for organic ranking. Diagnose-first content marketing inverts the sequence. You map your last 30-60 days of organic and direct traffic against the 8 Customer Value Journey stages, identify which stage is producing volume without conversion (the binding constraint at the content layer), and concentrate the next quarter’s content investment at that stage. Topic-cluster coverage is downstream of the diagnostic. Most SaaS teams skip the diagnostic and ship volume the system can’t use.
How many pieces of content per CVJ stage is realistic for a B2B SaaS team of 5-25?
Three to seven pieces per stage as the baseline coverage, then concentrated investment at the binding-constraint stage that takes the count there to 12-20 pieces in a quarter. Most teams over-invest at Aware (where coverage is already saturated) and under-invest at Convert, Excite, and Ascend (where conversion happens). The diagnostic decides the ratio — not a default content-cadence calendar.
How do I tell whether my content is producing fit-for-engagement leads or just traffic?
Two diagnostics. Test 1: trace your last 50 closed-won deals back through their first 5 content touchpoints. If the touchpoints concentrate at one CVJ stage (usually Convert or Excite), that stage’s content is producing fit-for-engagement leads. Test 2: trace your last 50 closed-lost deals back through theirs. If they concentrate at a different stage (usually Aware or Engage), your content is producing traffic, not leads. The gap between the two patterns is where the content investment is misallocated.
What does diagnose-first content marketing look like in a 90-day engagement?
Days 1-15: run the CVJ-content coverage diagnostic on existing content library, surface the binding-constraint stage. Days 16-45: produce 8-12 pieces of constraint-targeted content with operator framing tied to buyer-intent queries at the constraint. Days 46-75: instrument conversion at the constraint stage with stage-specific CTAs and tracking. Days 76-90: measure constraint-stage conversion delta and pipeline impact. A representative outcome on a $5M-$15M ARR vertical SaaS: 30-50 net-new fit-for-engagement leads, $300k-$700k pipeline opportunity surfaced at the constraint.
How do you put B2B SaaS content marketing into practice?
Every quarter, I rerun the Customer Value Journey diagnostic, find the stage that’s capping pipeline, and concentrate the next 90 days of content there. Constraints shift. The Convert-to-Excite gap that drained pipeline last quarter often clears once a product-led growth motion kicks in, and a new constraint surfaces upstream.
Stage-aligned content compounds in ways paid acquisition can’t, and the 3x returns only show up when the routing stays tight.
Your Next Planning Session: The One Question That Changes Everything
Ask one question: does this piece move a prospect through a specific CVJ stage transition, or does it just add volume? If the room can’t answer, the piece doesn’t get built. My job is to help SaaS teams stop talking engineering and start speaking customer pain, which means anchoring every brief in the audience questions actually stuck in your pipeline.
Run the CVJ diagnostic on your own funnel
Want to go deeper? Read fit-for-engagement leads or B2B content strategy for AI-search visibility.
A solid 15 years of Digital Marketing | AI & Automation | SEO & Content Marketing Strategy | Customer Value Journey.
Experience with businesses big & small: Globerunner (SEO & marketing agency), PowerSchool (B2B SaaS), PFSweb (e-commerce), Southwest Airlines (travel), and Mary Kay (beauty & skincare).


![AIO Marketing for B2B SaaS: 10 High Impact Strategies [2026]](https://growpredictably.com/wp-content/uploads/2024/07/AIO-Marketing-for-B2B-SaaS-768x432.png)