B2B SaaS NPS Benchmarks (2026): What a Good Score Is

Founder, Grow Predictably · 15+ yrs building B2B revenue systems

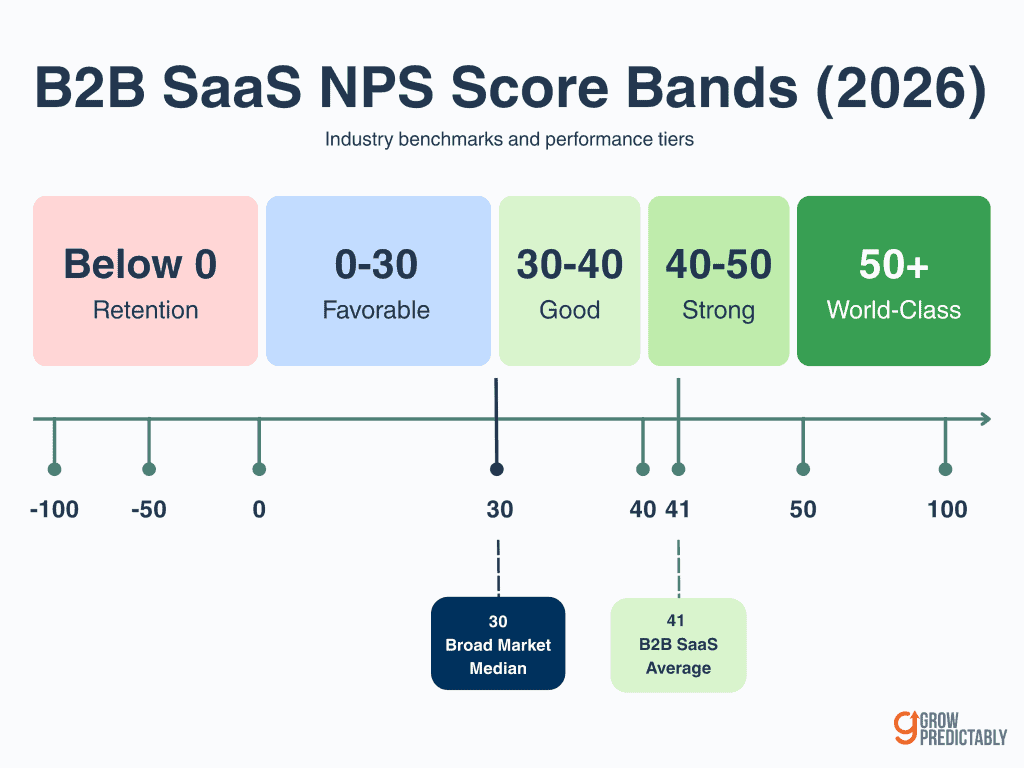
TL;DR: In 2026, B2B SaaS companies average an NPS around 41, while the broader software market median sits closer to 30. Read anything above 30 as good, above 40 as strong, and above 50 as excellent. The honest benchmark still depends on your ARR band, your survey type, and whether you compare to B2B or B2C peers, so a raw score means little until you place it against the right cohort.
Key Takeaways
- The broad SaaS median NPS for 2026 is about 30 (SurveySparrow), and the B2B Software and SaaS cohort specifically averages around 41 (Retently).
- There is no universal good score. Judge yours against your cohort, and under Bain’s scale treat above 50 as excellent, with the leading SaaS players scoring in the high 80s to low 90s.
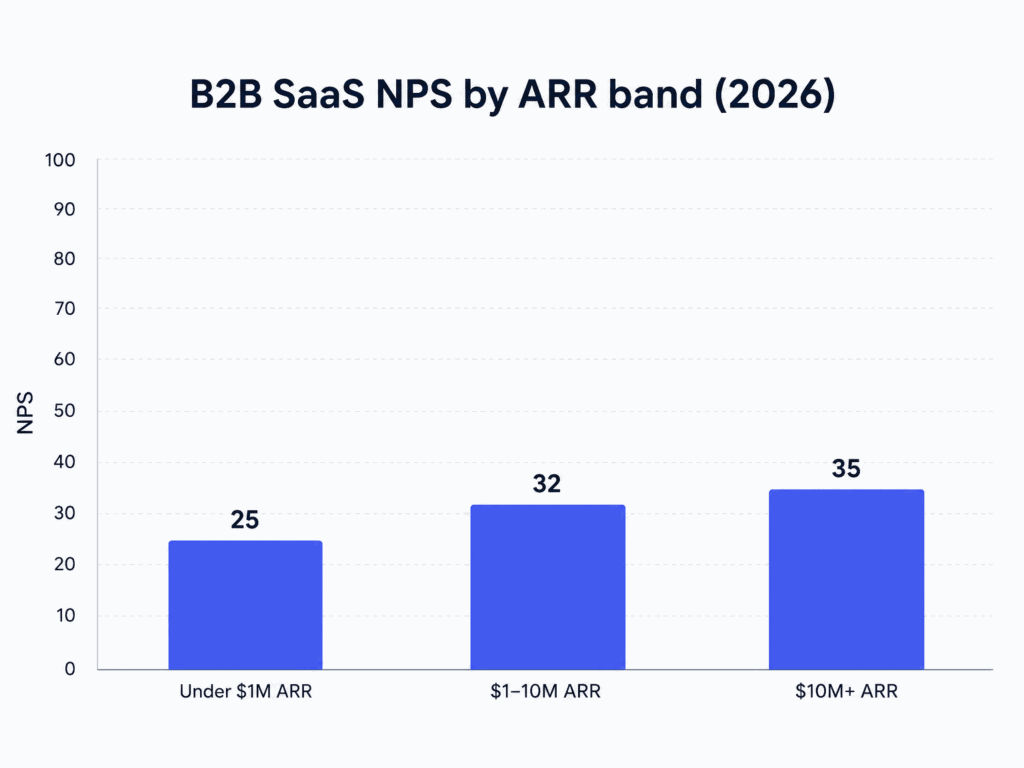
- Company size changes the benchmark. SaaS companies under 1 million dollars in ARR average an NPS near 25, while those above 10 million dollars average about 35.
- B2B and B2C software are different cohorts. Benchmarking a business tool against consumer-app scores will mislead you in both directions.
- Treat the score as a trend line that shows direction while other metrics explain the why. What moves it is time-to-value, onboarding, and closing the loop with detractors.
After 15 years of watching B2B marketing and growth leaders make and unmake decisions, the failure I trust least is a good metric read against the wrong benchmark. It does more damage than no metric at all, and NPS is where I see the damage clearly.
A capable B2B SaaS team pulls a healthy score, holds it up against a blended global average or a consumer app, and then either panics over a strong result or celebrates a weak one. In that scenario, the number is not the problem. The comparison is.
This guide is for the B2B SaaS founder, head of customer success, or head of product who just ran a survey, has a board asking how they compare to peers, and needs an answer they can defend by Friday. You already know what NPS is.
What follows is the current 2026 benchmarks for B2B SaaS, the bands by company size and cohort, and the honest caveats that separate a number that looks good from one that is.
What is a good NPS score for B2B SaaS in 2026?
There’s no single good NPS score for B2B SaaS. Any chart handing you one universal number is selling false precision. The better answer is a range tied to your specific cohort.
Two 2026 benchmarks anchor that range:
- SurveySparrow’s 2026 data puts the broad software market median at 30
- Retently’s 2026 benchmark reports an average of 41 for the B2B Software and SaaS cohort specifically
That gap, 30 for the broad market versus 41 for B2B software, matters more than either number on its own.
Treat the 30 as your target when you’re actually a B2B software company, and you’ve set the bar too low from the start. That’s the mistake the rest of this section works to prevent.
To read your own score, start from the four bands Bain and Company, the creators of NPS, suggest, as summarized by Qualtrics:
- Above 0: good. More promoters than detractors. Below zero is a retention problem, not a survey problem.
- Above 20: favorable.
- Above 50: excellent.
- Above 80: world class.
Those bands are generic across industries, which is why they read low for B2B SaaS: a 25 clears Bain’s favorable line and still trails both the broad software median near 30 and the B2B cohort average around 41.
These bands set a floor, not a verdict. CustomerGauge, which tracks thousands of B2B scores, makes the same point in its guidance: compare against your own sector’s median rather than a universal number, and treat a score above it as a good result.
Its data shows the leading SaaS players scoring in the high 80s to low 90s, a reminder that good for your segment and best in class are different questions.
B2B SaaS NPS benchmarks by company size
Company size moves the benchmark enough that a single market average can flatter or punish you unfairly. A 2 million dollar ARR startup and a 50 million dollar ARR scale-up shouldn’t measure themselves against the same line.
SurveySparrow’s 2026 data shows NPS rising with ARR:
- Under 1 million dollars: 25
- 1 to 10 million dollars: 32
- 10 million dollars and above: 35
Source: SurveySparrow, SaaS NPS Benchmarks 2026
The pattern is intuitive once you see it. Larger SaaS companies have had more time to fix the product, staff customer success, and smooth onboarding, so they earn more promoters.
An early-stage company posting an NPS of 27 actually sits slightly ahead of its own ARR band, even though the raw number looks low. A scale-up at 30, by contrast, is quietly under its peers even though the number looks similar. Read your score against your revenue band before you celebrate or worry.
The band only works if you know which revenue number anchors it. If your team still debates whether to steer by monthly or annual recurring revenue, settle that first: MRR and ARR answer different questions, and the benchmark you pick inherits the answer.
Why B2B and B2C software benchmarks are not the same
B2B and B2C software are different cohorts, and mixing them is how a strong score gets misread as mediocre. The two audiences answer different questions:
- Business buyers judge software on procurement, security, uptime, and how a whole team adopts it
- Consumers judge an app on whether they personally enjoy it
Because those are different questions, the scores aren’t comparable, and a benchmark that blends them helps no one.
Retently’s 2026 data shows the spread clearly. Average NPS across B2B industries ranges from 41 to 68, while B2C ranges from 26 to 68, with wider variation across consumer categories. B2B Software and SaaS lands near the bottom of the B2B range at 41, which is why benchmarking a business tool against a flattering consumer number sets a false target.
There’s a second layer inside B2B: who you survey changes the score. Gainsight’s Customer Success Index found a gap between everyday users, with an NPS of 36, and executive buyers, with an NPS of 46.
If your survey reaches mostly champions and executive buyers, expect a higher number than a survey that reaches daily end users. Neither is wrong. They answer different questions, and you should know which one you’re asking before you compare.
How is NPS calculated, and which number misleads you?
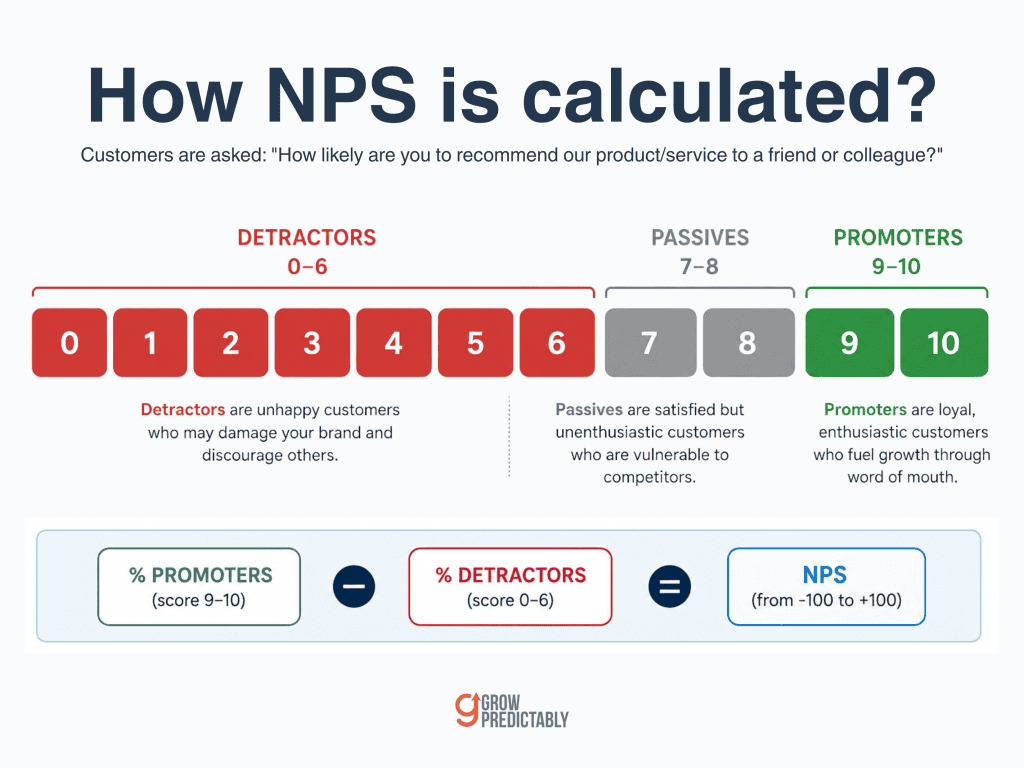
NPS comes from a single question: “How likely are you to recommend us, from 0 to 10?”
The formula is the percentage of promoters minus the percentage of detractors, with passives excluded entirely, on a scale from -100 to 100.
Qualtrics groups respondents into three buckets:
- Promoters: score 9 or 10
- Passives: score 7 or 8
- Detractors: score 0 through 6
A worked example makes it concrete. Say 200 customers respond. If 110 are promoters, 50 are passives, and 40 are detractors, then promoters account for 55 percent and detractors for 20 percent. Your NPS is 55 minus 20, which is 35. Notice that the 50 passives never touch the math directly, even though they made up a quarter of your respondents. That’s by design, and it’s also the first clue about why the metric can mislead.
That simplicity is both the strength and the trap. Because passives are excluded, two companies with very different customer bases can post the same score, and one number can’t tell you why. The bigger distortion is survey design:
- Relationship NPS, sent on a schedule to your whole base, measures a different moment than
- Transactional NPS, fired right after onboarding or a support ticket
Those two approaches produce different scores from the same customers. Sample size and response bias move the number too. A survey concentrated among your happiest, highly engaged accounts will read higher than reality.
The practical rule is to hold your method constant. Compare relationship NPS to relationship NPS, keep the timing and the channel stable, and treat a swing as real only when the sample is large enough to trust. A score that jumps 8 points because you changed when you asked is measuring your survey, not your customers.
What actually moves NPS in B2B SaaS
Generic advice says to delight customers. That’s too vague to act on by Monday morning. The real drivers of B2B SaaS NPS are specific and operational.
Start by checking time-to-value. In my experience, customers who reach their first real outcome quickly are more likely to become promoters, while customers who stall in onboarding can become detractors before they see what the product can do. Gainsight’s analysis reinforces the broader diagnostic: day-to-day end-user experience matters alongside executive buy-in. These three operational levers give the team something concrete to change after the survey:
- Onboarding quality
- In-app guidance
- The coverage ratio of customer success managers to accounts
Closing the loop with detractors makes the score actionable. A promoter who scores you a 9 is already satisfied. Under Qualtrics’ NPS categories, a customer who scores you a 4 is a detractor with a concrete failure to investigate. A real follow-up, a fix, and a call can address that failure. Closing the loop turns a low score into a specific failure the team can investigate and repair.
The discipline I hold in every engagement is to connect the dashboard number to revenue, risk, and competitive position rather than treating it as a scoreboard. NPS earns its place only when it’s tied to money. The next benchmark documents the relationship between retention and growth, not proof that NPS causes either.
SaaS Capital’s 2025 research found that lifting net revenue retention from the 90 to 100 percent band into the 100 to 110 percent band is associated with a growth-rate improvement of about 5 percentage points. NPS is a loyalty signal. NRR is the financial outcome. The study does not establish that NPS causes growth. It shows why retention deserves financial attention. When loyalty leaks, the damage can surface later as stalled growth, a pattern I map in why a B2B SaaS growth strategy stalls after 5 million dollars in ARR.
Fred Reichheld, the creator of NPS at Bain and Company, made the mechanism plain in Harvard Business Review:
“The only path to profitable growth may lie in a company’s ability to get its loyal customers to become, in effect, its marketing department.”
Fred Reichheld, creator of NPS, Bain and Company (Harvard Business Review, 2003)
In B2B SaaS, where a handful of reference accounts and word of mouth inside an industry can decide a deal, that’s the growth model itself. The point of raising NPS is to manufacture more of those advocates.
Are there limits to NPS, and when should you add CSAT or CES?
NPS is a good north star and a poor diagnosis. Because one number hides the reasons behind it, it tells you the direction of loyalty without telling you what to fix. Run NPS as the headline metric, then layer in others at the specific moments where you need the why.
NPS still dominates B2B measurement. SurveySparrow reports that 41 percent of B2B companies use NPS, versus 26 percent for CSAT and 11 percent for CES. The other two are complements that sit alongside NPS, not replacements:
- CSAT (customer satisfaction) measures how a specific interaction felt, so it fits right after a support resolution or a feature launch
- CES (customer effort score) measures how hard something was to do, so it fits at friction points like onboarding, setup, or first integration
Run NPS on a schedule to track loyalty as a trend. Add CSAT and CES at the touchpoints where you need to know why a moment worked or failed. The combination gives you the trend line and the diagnosis, which no single metric delivers alone. This is also where acting on feedback at scale becomes a system rather than a quarterly scramble.
Which NPS software fits B2B SaaS?
The benchmarks in this piece only matter if you are collecting the score somewhere, with the same method each quarter. Tool selection can stall the work, so here are three options to consider in 2026. Each has a different center of gravity.
- Retently: collects NPS, CSAT, and CES through email, SMS, and in-app surveys, with automated follow-up actions.
- AskNicely: turns real-time customer feedback into recommended actions for customer-facing teams.
- Survicate: collects surveys across email, websites, and apps, useful when NPS is one of several feedback loops you track.
The tool matters less than surveying consistently and closing the loop with detractors. Pick one, keep the method stable, and the benchmarks above become a trend you can act on.
How do you benchmark your own NPS the right way?
Benchmarking your NPS well is a discipline, not a one-time lookup against a chart. The goal is to compare like with like, so the number tells you something true about your own trajectory rather than flattering or scaring you.
The first move I make with a team is to throw out the global average and rebuild the comparison around their ARR band and their B2B cohort. From there, follow four steps in order.
- Compare to the right cohort. Use the B2B Software and SaaS average near 41 and your ARR band, rather than a blended global average or a consumer number.
- Hold the method constant. Compare relationship NPS to relationship NPS, keep the channel and timing stable, and note who you surveyed: users or buyers.
- Use your own baseline as the truest benchmark. The honest comparison is your score last quarter against your score this quarter, with the same method.
- Track the trend and tie it to revenue. A rising NPS that moves alongside net revenue retention is a growth signal. A number that sits in a slide with no revenue link is vanity.
Then comes the part the chart cannot do for you: presenting the number to a board without losing the room. That is a translation job, and executive communication for technical SaaS founders is the discipline built for it.
The goal is to know whether loyalty is trending up against the right peers, and whether that trend is showing up in retention and expansion. Track NPS alongside retention and expansion metrics because the score is diagnostic, not itself a revenue result.
If your NPS is sitting behind your cohort and you want to find the specific constraint holding growth back, take the Growth Gap Scan. It maps the distance between where your loyalty and growth signals are and where they need to be, so your next move is obvious rather than another survey.
Frequently Asked Questions
What is a good NPS score for B2B SaaS?
A good NPS for B2B SaaS in 2026 is roughly 30 or higher, in line with the broad software market median of about 30 per SurveySparrow. Narrowed to the B2B Software and SaaS cohort specifically, the average rises to about 41 per Retently. Treat 40 or higher as strong and above 50 as excellent. The right target depends on your ARR band and whether you compare to B2B or B2C peers.
What is the average NPS for SaaS companies in 2026?
The 2026 median NPS across the broad software market is about 30 per SurveySparrow. B2B Software and SaaS specifically averages around 41 in Retently’s 2026 benchmark. Use the figure that matches your cohort, because a blended all-software number understates the bar for a B2B software company.
How does B2B SaaS NPS compare to B2C?
B2B and B2C software are different cohorts and should not be benchmarked against each other. Retently’s 2026 data shows B2B industries averaging 41 to 68 and B2C ranging 26 to 68, with wider swings across consumer categories. Business buyers judge software on security, uptime, and team adoption, while consumers judge personal enjoyment, so the same score means different things.
How is NPS calculated for a SaaS company?
NPS comes from one question: how likely are you to recommend us, from 0 to 10. Promoters score 9 to 10, passives 7 to 8, and detractors 0 to 6. The score is the percentage of promoters minus the percentage of detractors, with passives excluded, on a scale of negative 100 to positive 100. For example, 55 percent promoters minus 20 percent detractors equals an NPS of 35.
How often should B2B SaaS companies measure NPS?
Measure relationship NPS on a fixed cadence that makes trends visible without creating survey fatigue. Send transactional NPS right after a key event like onboarding or a support resolution. Keep the timing and channel consistent across periods, because a score that shifts only because you changed when you asked is not a real change in loyalty.
Should B2B SaaS use NPS, CSAT, or CES?
Use NPS as the relationship-level metric and add the others at specific touchpoints. SurveySparrow reports 41 percent of B2B companies use NPS, versus 26 percent CSAT and 11 percent CES. Use CSAT to measure how a specific interaction felt, and CES to measure how hard a task was. NPS shows the loyalty trend, and CSAT and CES explain the why.
About the author
Brian helps B2B founders install marketing + automation engines powered by Co-Thinking with AI. With 15+ years building predictable revenue systems, he's worked with SaaS, agency, and service businesses on 90-day done-with-you growth accelerators.
Ready to see your real growth gap?
Two minutes in the Growth Gap Scan and you walk away knowing the one thing capping your pipeline. Free, no obligation.