Why Your B2B SaaS Growth Strategy Stalls After $5M ARR (And How to Fix It)

Founder, Grow Predictably · 15+ yrs building B2B revenue systems

TL;DR: A B2B SaaS growth strategy works when you diagnose the binding constraint on your Customer Value Journey before adding another dollar of headcount or media. Most teams add SDRs, content, and tools at every stage and produce activity without compounding pipeline. The bottleneck is rarely where the activity is. It sits at the one CVJ stage you haven’t diagnosed yet.
Key Takeaways:
- The binding constraint is the single Customer Value Journey stage capping your pipeline, and Theory of Constraints says every dollar spent elsewhere is wasted until you fix it.
- Standard advice (more SDRs, more inbound marketing, more tools) fails past $5M ARR because it prescribes interventions before diagnosing which stage is actually stuck.
- The Growth Diagnosis process walks each CVJ stage in order, scores conversion rates and time-in-stage, and names the one upstream gap that explains the downstream symptom.
- Channel mix matters once the constraint is known. According to Your Content Mart, organic customer acquisition averages $205 versus $341 for paid, so constraint-aware investment compounds while sprayed budget burns.
- This quarter, audit one cohort end to end across acquisition, onboarding, customer support, and global expansion touchpoints, find the stage where conversion drops most, and concentrate next quarter’s spend there.
Most B2B SaaS teams I work with past $5M ARR are stacking growth investments the way they stack browser tabs. Two more SDRs this quarter, a new content agency, three pieces of mar-tech, a podcast tour, and a refreshed deck. Activity goes up across every stage of the customer lifecycle. Pipeline does not. Churn rate inches the wrong direction. And nobody on the leadership team can point to which single intervention is supposed to move which number.
This article walks founders, CMOs, and Heads of Growth through the Customer Value Journey diagnosis, Goldratt’s Theory of Constraints applied to that journey, and the cohort-audit timeline I use to find the binding constraint before next quarter’s budget gets committed.
This is for the founder, CMO, or Head of Growth whose pipeline has plateaued between $5M and $50M ARR despite headcount up 30%, content output doubled, and a market timing window that should be working in your favor.
The work that follows is what diagnose-first looks like at the growth-strategy layer: not “add another channel and hope,” but “audit one cohort end to end and concentrate every dollar at the stage where value is actually leaking.”
What is a B2B SaaS growth strategy that actually compounds?
A B2B SaaS growth strategy that compounds concentrates investment at the single Customer Value Journey stage capping pipeline throughput, clears it in 60-90 days, then re-diagnoses. The bottleneck is rarely where the activity is. It sits at the one CVJ stage nobody has actually run a diagnosis on.
Compounding vs. Additive Growth
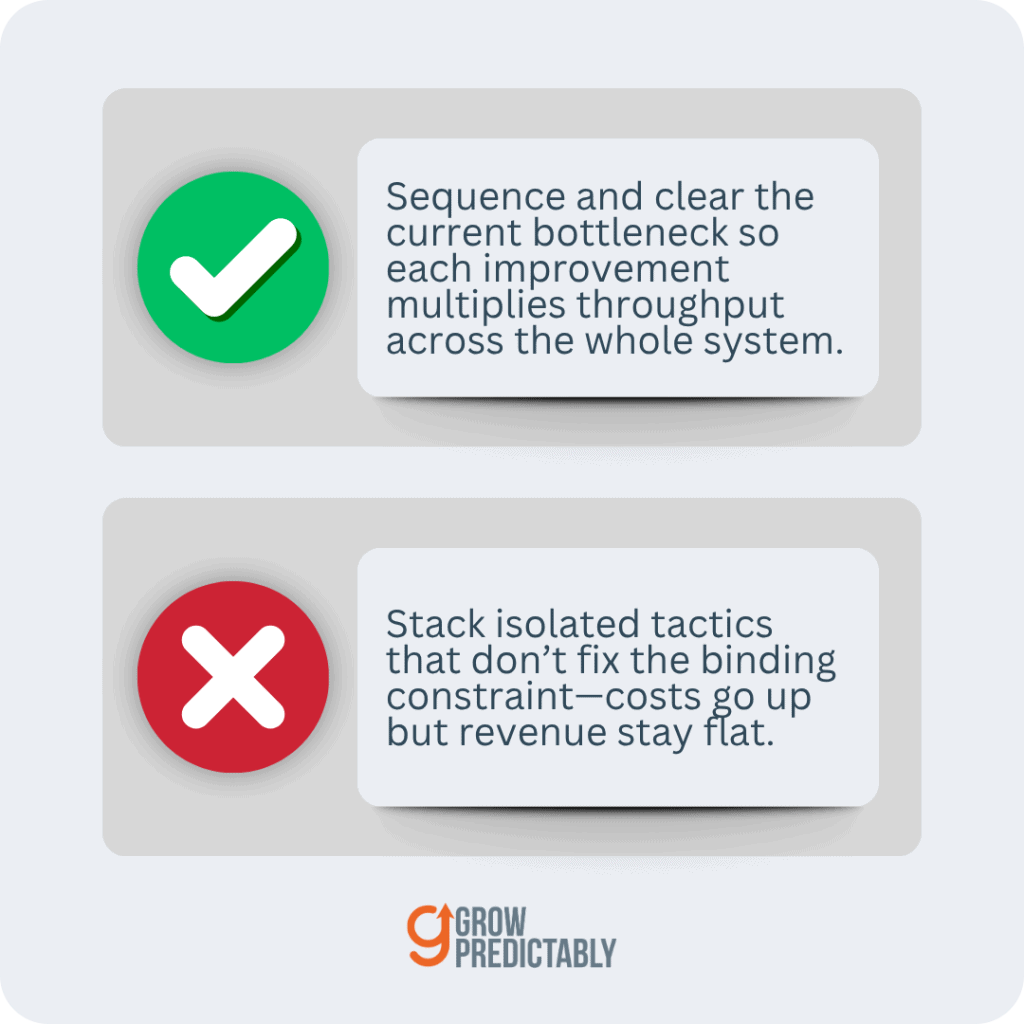
Most go-to-market strategies I see stack tactics. More SDRs. A fresh content strategy. Another pricing strategy. ARR stays flat because the team optimized everywhere except the binding constraint. Goldratt’s Theory of Constraints is clear here. Investment outside the binding constraint produces zero system-level lift. That’s the difference between a compounding growth engine and an additive one.
Compounding sequences. Each cleared constraint raises throughput across earlier stages and re-routes pipeline forward. Additive layers cost.
When you run this correctly, you’ll move through three or four constraint cycles a year, and real revenue growth follows. (Why most B2B SaaS growth strategies fail walks through the failure pattern in more detail.)
The CVJ as a Diagnostic Map
I use the Customer Value Journey as the diagnostic map. Eight stages, from Aware through Promote. Your SaaS marketing engine doesn’t fail uniformly. It fails at one stage. The CVJ gives your team shared vocabulary to locate where prospects stall before any budget decision gets made.
In my experience, founders treat growth as a volume problem. More traffic. More leads. The actual question is a flow question. Where is your constraint? When I work with teams past $5M ARR, the binding constraint usually sits at Convert-to-Excite or Excite-to-Ascend. The top of funnel everyone keeps feeding is rarely the problem.
Why NRR Is the Hidden Multiplier
Net Revenue Retention is where the math gets brutal. According to SaaS Capital (2025), moving NRR from the 90-100% band to the 100-110% band improves overall growth rate by 5 percentage points. That’s a structural lift no organic growth program or innovation strategy can match by adding activity.
Your other growth metrics will rise across the board once retention compounds inside the customer base.
The line worth keeping close: “Lost in the process, we neglect strategy. In B2B SaaS, we’re so deep in the weeds that we can’t focus on delivering value to customers.” If your dashboard says traffic is up and pipeline is flat, the constraint isn’t where you’re looking.
It’s at the one stage you haven’t diagnosed against the CVJ yet.
How do you diagnose which CVJ stage is the binding constraint in your SaaS?
Pull your last 10 deals from CRM and map each across the 8 stages of the Customer Value Journey. The stage with the steepest drop in conversion rate is your binding constraint, not the stage with the loudest activity. Fixing anything else just buys you more inventory at the bottleneck.
Goldratt’s Theory of Constraints says non-constraint stages have excess capacity by definition. Pour resources there and you don’t get growth, you get backlog. Leads rotting in the CRM. Trials going cold. Customers who bought once and disappeared.
I’ve worked with B2B SaaS teams for years, and the first instinct when conversion drops is always the same. Pump top-of-funnel volume. Run another inbound campaign. Hire another SDR. The constraint is rarely where the activity is.
The Five-Step CVJ Audit
This is the Growth Diagnosis I run with every team before we touch a tactic:
| Step | Instruction |
|---|---|
| 1 | Map the CVJ stages. |
| 2 | Walk your last 5 closed-won and 5 closed-lost deals across all 8 stages. Note buyer behavior, time at stage, and owner. |
| 3 | Instrument each transition. Stage-by-stage conversion data is the only signal that matters here. Vanity metrics like total leads or page views hide the constraint. |
| 4 | Rank drop-off severity. The transition where the steepest conversion drop happens is your candidate. |
| 5 | Confirm with your team. Ask your top AE and senior CSM where deals stall. If their read matches the data, you have signal. When it diverges, the data wins. |
| 6 | Name the constraint in one sentence. “Our binding constraint is at Excite, customers close but don’t activate in 72 hours.” |
Reading the Conversion Waterfall
Use actionable metrics, not aggregates. A stage converting at 8% to the next stage is the binding constraint regardless of how much lead volume sits upstream. Your conversion waterfall tells you where product-market fit is real and where it leaks.
According to SaaS Capital, lifting net revenue retention from the 90-100% band into 100-110% boosts growth rates substantially, and NRR is almost always a downstream symptom of an upstream CVJ leak.
The Convert-to-Excite Transition
In most B2B SaaS businesses I work with, the constraint lives between Convert and Excite. The prospect became a buyer, but the early customer experience didn’t validate the promise. Product visibility was strong enough to close. The Excite moment, the first 72-hour aha, was never engineered. Product-market fit gets blamed.
The actual culprit is an unengineered handoff that no one owns.
If your funnel looks healthy at the top and pipeline still feels flat 90 days later, that’s the gap to investigate first. Economic challenges sharpen the math, you can’t out-spend a constraint, you have to diagnose it.
Why does the standard SaaS growth advice fail past $5M ARR?
The standard playbook (more SDRs, more content, more ad spend) stops working past $5M ARR because the binding constraint has moved. Below $5M, extra volume papers over a leaky funnel and you see lift. Past $5M, that same volume amplifies whatever is broken downstream.
The bottleneck is rarely where the activity is. It’s at the one Customer Value Journey stage you haven’t diagnosed.
The $5M ARR Inflection Point
Across the B2B SaaS teams I’ve worked with, the same growth advice gets recycled regardless of whether the company is at $1M or $10M ARR. That’s the first failure. Below $3M, the constraint usually sits at Aware or Engage, so adding pipeline activity (paid, SDRs, content) actually moves buyer engagement. Past $5M, the constraint has migrated to Convert, Excite, or Ascend.
Hiring another SDR there is like adding water to a bucket with a hole in the bottom. The churn rate quietly absorbs every gain.
When Front-of-Funnel Investment Backfires
When pipeline drops past $5M, the instinct is always front-of-funnel. More awareness. More leads. More content. But without pinpointing where value is actually leaking, all that effort is inventory, not growth. I had to learn this the hard way. For years I watched founders (and frankly, my own past self) chase traffic and lead volume while the real constraint was retention.
The data analytics looked fine on a dashboard. The cohort behavior told a different story.
The Retention-Growth Link
Retention is the floor that determines your ceiling. According to Zylo, among companies with high gross revenue retention, 49% also maintain high net revenue retention. The mechanism is well-documented: SaaS Capital found growth rate is positively and exponentially correlated with net revenue retention. Translation: fix what happens after the sale and growth compounds.
Skip that diagnostic and your product development roadmap, your fit-for-engagement leads work, and your demand creation spend all sit on top of a leak. If your funnel is misbehaving past $5M, the question I’d start with isn’t “how do we get more,” it’s “where exactly is the value leaking, and what’s the one stage we haven’t actually diagnosed?”
What does diagnose-first growth look like in practice for a B2B SaaS team?
In practice, diagnose-first growth means a team runs a Customer Value Journey conversion audit before any budget call, picks the one stage where pipeline is leaking the most, and concentrates a single intervention there for a full quarter. The bottleneck is rarely where the activity is — it’s at the one CVJ stage you haven’t diagnosed.
This is what Growth Gap Marketing does in motion. It pulls a team off the reactive treadmill of “add another SDR, another channel, another tool” and points the next dollar at the constraint the audit named. Every stage downstream of that constraint is just inventory until you unlock it.
Running the CVJ Conversion Audit
I start every engagement the same way: walk each stage of the journey and ask where value is actually leaking. Not “how do we get more traffic?” — that’s the prescription-before-diagnosis move. The audit produces a ranked list of constraint candidates, with conversion rate optimization framed at the stage level rather than the page level.
Whichever stage shows the steepest fall-off — and the highest expected lift if cleared — becomes the quarter’s focus. Everything else gets parked.
Constraint-Specific Interventions by Stage
In the work I do with B2B SaaS teams, the constraint sits at the Excite-to-Convert transition more often than anywhere else. Buyers see the demo, nod along, then go quiet. The intervention is not more leads. It’s engineering the “aha” moment — a tighter first-value milestone, an in-app trigger, a named success motion that turns activation into a designed event rather than a hope.
That same discipline carries into customer retention: when expansion or renewal is the binding constraint, the fix is a deliberate Ascend motion, not louder LinkedIn marketing or another nurture sequence.
The Messaging-to-Market Fit Check
Sometimes the constraint sits earlier — in the Aware-to-Convert transition — and it’s almost always a messaging problem. I once worked with a deeply technical founder who knew his product cold but couldn’t get a buyer past the second meeting; the language gap was the entire bottleneck. The translation layer fix is the goal: help SaaS teams stop talking engineering and start speaking customer pain.
When market positioning describes the buyer’s problem in the buyer’s words, the Aware-to-Convert lift shows up without any new traffic. The discipline is the same as every other stage — diagnose first, then concentrate the intervention where the system is actually pinched, and let the fit-for-engagement leads compound from there.
How do you measure whether your growth strategy is working at the constraint?
You measure constraint movement by tracking the conversion rate at the specific Customer Value Journey stage you intervened on, not aggregate pipeline. Stage-level lift shows up in days. Revenue confirmation arrives later, through net revenue retention. If your dashboard only watches volume at the top, you’re flying blind on the stage that’s actually choking you.
Constraint Metrics vs. Vanity Metrics
My Growth Gap Marketing work runs on actionable metrics, not vanity aggregates. The difference matters. Page views, MQLs, demo requests, raw lead counts. These are product distribution metrics. They tell you the top of the funnel is moving. They tell you nothing about whether the binding constraint downstream just got worse.
In my experience reviewing SaaS growth dashboards, the metrics that get tracked are almost never the metrics at the actual constraint stage. Teams will pour budget into Google Ads, optimize landing-page value proposition copy, and ship dashboards full of activity. The constraint stage often has no metric on the wall at all.
The Growth Scorecard in Practice
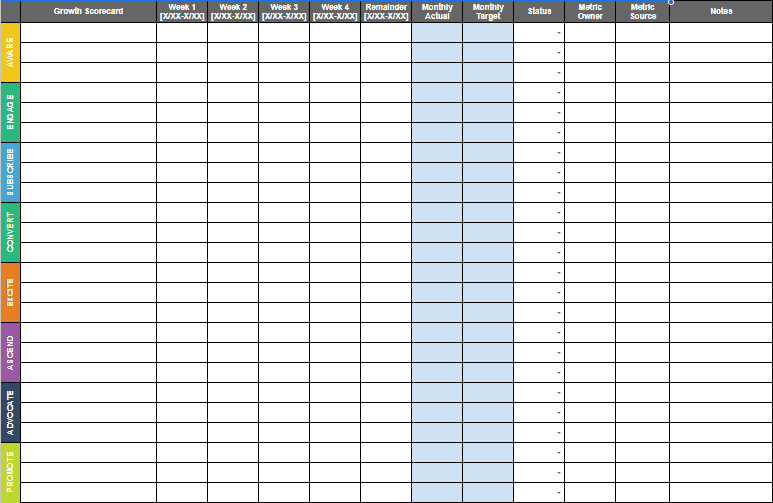
The Growth Scorecard assigns a leading indicator to every CVJ transition. Subscribe-to-Convert. Convert-to-Excite. Excite-to-Ascend. One metric per stage. One owner per stage. You watch the diagnosed constraint stage weekly and look for delta against baseline.
A real intervention at the constraint should move that stage’s conversion 5 to 15 points within 60 to 120 days. If you see less than three points of lift after a quarter, the intervention isn’t working or you misdiagnosed the constraint. Either way, you stop and re-diagnose before adding more activity.
NRR as the Lagging Confirmation Signal
Net revenue retention is how you know constraint work has compounded. According to SaaS Capital (2025), moving NRR from the 90-100% range into the 100-110% range produces a 5-point growth-rate lift. That’s the lagging signal that confirms a Convert-to-Excite intervention is real.
The alignment is structural. Zylo (2026) reports that 49% of companies with high gross retention also hold high net retention. Floor-of-funnel health predicts ceiling-of-funnel growth. No amount of digital transformation tooling changes that math. If your NRR isn’t climbing, your constraint hasn’t moved yet.
What does the doctor-diagnose-first approach mean for your next quarter’s planning?
Diagnose-first planning means your next quarter opens with two weeks of Customer Value Journey diagnosis before a single budget line gets approved. No SDR hire, no campaign brief, no tooling renewal until the binding constraint is named. The doctor doesn’t prescribe before the exam, and your growth plan shouldn’t either.
I’ve watched too many planning sessions open with last quarter’s bets carried forward and a diagnosis written in to justify them. That’s the inversion I want you to make.
The Diagnose-First Planning Calendar
Here’s how I’d run your first two weeks. Pull your last ten deals. Map each one against the eight CVJ stages and mark where it stalled, churned, or under-converted. Whatever stage shows the worst conversion delta is your binding constraint for the quarter. Only then do you write the OKRs.
The diagnostic isn’t a slide in the deck. It’s the first slide, and everything downstream answers to it.
Applying the Constraint Lens to Budget Decisions
The Constraint Lens is a forcing function I use to filter every proposed initiative through one question: does this directly address the confirmed constraint, or is it activity at a stage that’s already at excess capacity?
If the answer is the second one, the spend doesn’t happen this quarter — even if it looks like market expansion or sales acceleration on paper. Channel mix matters here too.
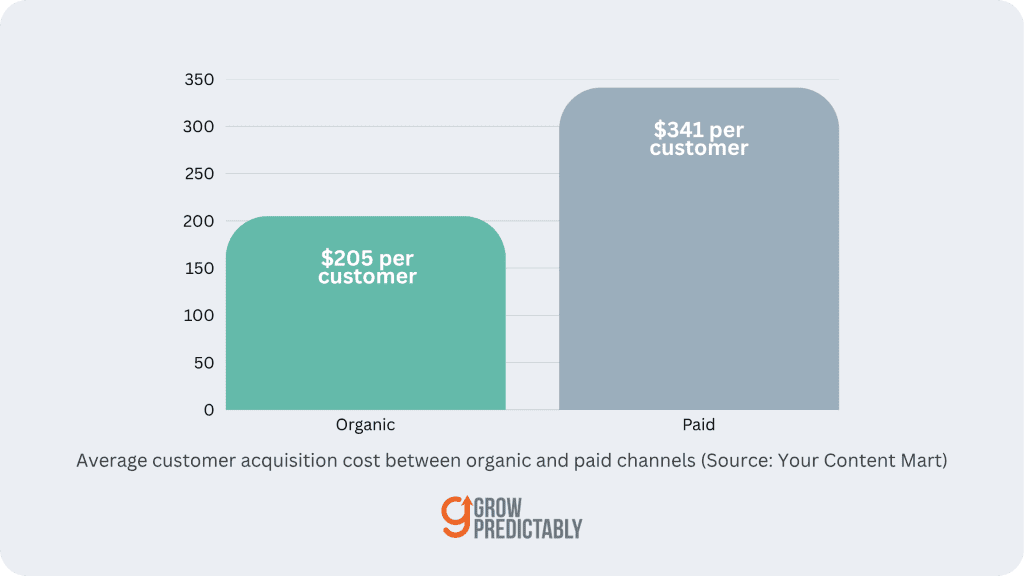
According to Your Content Mart, organic CAC averages $205 versus $341 for paid, so constraint-aware channel selection compounds the business impact over multiple quarters.
What to Stop Doing This Quarter
Across the B2B SaaS planning cycles I’ve sat in, the most common waste is continuing to fund stages already at excess capacity because the real constraint is two stages downstream. Retention problems often masquerade as acquisition problems, so adding fit-for-engagement leads on top of a broken Excite moment buys you nothing but louder churn.
If your dashboard shows healthy product reach but flat NRR, stop funding the top of funnel and re-diagnose.
How do you start running diagnose-first growth strategy this quarter?
Start with a structured CVJ conversion audit on your last 10 deals before you greenlight any new growth bet this quarter. Rank stage-by-stage drop-off, name one binding constraint, then commit a 90-day sprint to it. The constraint hides in your data, and until you find it everything else is inventory.
Week 1: The CVJ Conversion Audit
The first move is the Growth Diagnosis: a structured pass through your last five closed-won and five closed-lost deals, mapped across all eight Customer Value Journey stages. Note where lost deals stalled. Note what unlocked the wins.
The output isn’t a slide deck. It’s a ranked list of transitions by drop-off severity, with one constraint named at the top.
If your CRM data is thin, run a jobs-to-be-done interview series with 3-5 recently churned accounts and 3-5 recently expanded ones. Qualitative signal beats analytics noise when the sample size is small.
You’ll surface the constraint faster, and your customer lifetime value math will start telling the truth.
Week 2-4: Constraint Confirmation
Validate the diagnosis with your top AE and senior CSM before you spend a dollar. If their gut matches the data, you have high-confidence signal. If it doesn’t, document the divergence. The gap is often where the real root cause lives.
I’ve watched Goldratt’s Theory of Constraints play out on customer journeys for years, and the pattern repeats: most growth teams over-invest in non-constraint stages because that’s where the activity feels productive. The campaign alignment looks fine on paper. The pipeline still leaks.
The fix is brutal concentration at the one stage the system can’t push past.
The 90-Day Constraint Sprint
Once the constraint is named, run a single 90-day sprint with the Growth Scorecard tracking stage-specific leading indicators weekly. Conversion rate at the bottleneck. Time-in-stage. Activation completion. Watch leading indicators move before quarterly revenue does, and you’ll know the intervention is working.
For teams running their first constraint diagnosis, I’d recommend a half-day CVJ workshop before sprint planning: map the journey, assign conversion-data owners at each stage, and lock the constraint hypothesis as a team. Lightweight AI integration helps too.
LLM tooling can summarize call transcripts and surface stall-stage language faster than manual review.
Ground your audit in the full 8-stage Customer Value Journey before you start.
⮞ How long does it take to see results from a diagnose-first growth strategy?
Most teams see a measurable lift inside one quarter once they concentrate budget at the binding CVJ stage. The signal shows up first as a conversion-rate change at that one stage, then flows through to pipeline two to four weeks later. Net revenue retention and expansion shifts trail by another quarter because the cohort has to mature. According to ProductLed’s 2025 analysis of 446 SaaS companies, net revenue retention becomes the dominant scalability lever past the $5M mark, so the second wave of results matters more than the first.
⮞ What team size do you need to run this properly?
A single growth lead plus one analyst is enough to diagnose the binding constraint and run the first fix. The diagnostic itself is a one-week exercise across the CVJ stages, not a department. What kills it is splitting the work across three or four owners who each see only their slice of the funnel, because the constraint hides in the hand-off between stages. Keep ownership of the diagnosis with one person, then pull in channel specialists once the constraint is named.
⮞ How is this different from a typical revenue operations audit?
A RevOps audit usually starts with tooling, data hygiene, and process mapping across every stage. Diagnose-first starts with one question: which CVJ stage is capping pipeline right now? RevOps gives you a clean system. Diagnose-first gives you the next move. Both are useful, but if you only have budget for one, the diagnostic answers what to fund next quarter. The RevOps cleanup can run in parallel without competing for the same growth investment.
⮞ What does this approach mean for market expansion into a new segment?
Market expansion needs its own CVJ diagnostic before you copy the playbook from your core segment. The binding constraint in a new vertical is almost never the same stage that was capping the core business, because awareness, fit-for-engagement signals, and buying triggers shift. Run the diagnostic on a small cohort in the new segment first, name the constraint, then concentrate spend there. Treating expansion as a scalability play on the existing motion is the most common reason new-segment bets stall at pilot.
How do you put B2B SaaS growth strategy into practice?
Putting this into practice isn’t another playbook. It’s a posture shift: you stop allocating against activity and start allocating against the constraint. Most teams I work with can implement this inside a quarter once they’re willing to sit with two weeks of diagnostic discomfort before approving the next campaign.
The Compounding Logic of Constraint Removal
Here’s what I’ve seen happen when a team commits to it. You name the binding stage on your Customer Value Journey. You move budget, headcount, and content production there. Throughput at that stage lifts, and the next constraint surfaces somewhere else in the journey, usually further downstream.
You repeat. Each pass raises the system’s ceiling, which is why diagnose-first growth compounds while spray-and-pray doesn’t. According to SaaS Capital’s 2025 benchmarks, pushing net revenue retention from the 90 to 100% band into the 100 to 110% band correlates with a meaningful lift in overall growth rate, which is exactly the band you unlock when monetization and retention stop bleeding at a single stage.
From Diagnosis to Durable Advantage
The teams I see pulling ahead aren’t running more paid advertising, hiring more SDRs, or forcing more cross-department collaboration meetings. They’re systematically removing one constraint per quarter and watching every other metric lift as a result. That’s the move from reactive growth patterns to proactive, predictable revenue generation, which is the whole point of Growth Gap Marketing.
Stop asking how to get more traffic. Start asking where your constraint is.
Your Next Step
Before you approve next quarter’s growth budget, name your current binding constraint on the journey. Then concentrate spend there.
Map your binding constraint on the Customer Value Journey
Want to go deeper? Read Why most B2B SaaS growth strategies fail or the fit-for-engagement leads playbook.
About the author
Brian helps B2B founders install marketing + automation engines powered by Co-Thinking with AI. With 15+ years building predictable revenue systems, he's worked with SaaS, agency, and service businesses on 90-day done-with-you growth accelerators.
Ready to install your predictable revenue engine?
Book a free strategic growth session. Walk away with a tailored 90-day blueprint and 3 quick wins you can use this week.