Sales Funnel Velocity: Fix the Constraint, Not the Funnel

Founder, Grow Predictably · 15+ yrs building B2B revenue systems

TL;DR: Sales funnel velocity is a throughput number, opportunities times average deal size times win rate, divided by sales cycle length. It rises only when you find and fix the one stage that caps the system, not when you push all four variables at once or buy more leads. In the funnels I diagnose, that one stage is most often the unengineered handoff right after the sale, which is why a velocity problem so often turns out to be a retention problem wearing a disguise.
Key Takeaways
- Sales funnel velocity measures how fast opportunities turn into revenue, calculated as opportunities times average deal size times win rate, divided by sales cycle length.
- A funnel is one system, and its throughput is capped by a single constraint stage, so pushing every stage at once rarely moves the number.
- Adding more opportunities inflates the numerator but not real throughput when deals stall downstream, and Dixon and McKenna found 40 to 60 percent of deals end in no decision.
- In the funnels I diagnose, the constraint clusters at the Convert-to-Excite handoff after the sale, where a stretched promise turns into churn and silent customers.
- The fix sequence is to instrument every stage, find the one constraint, fix that stage only, then re-measure before touching anything else.
For most B2B SaaS teams, the velocity number goes flat while the dashboard around it looks busy, with lead volume up and reps working harder than ever. The reflex is to push all four levers in the sales velocity formula or to buy more pipeline. Both moves spend money on stages that were never the problem.
This article walks the revenue leader, head of growth, or RevOps owner through the sales velocity formula, the Theory of Constraints applied to a funnel, and the Customer Value Journey view that extends past the sale into the first customer win. It is for the leader whose velocity is stalling even though activity is climbing, and whose board wants revenue sooner. What follows is what the diagnosis looks like at the funnel level.
When I audit a funnel, the stage that is actually capping throughput is rarely the one the team is looking at, so the job is to find the one stage that caps the system and fix that stage first.
What is sales funnel velocity?
Sales funnel velocity tells you how quickly opportunities convert into revenue over a set period.
I think of it as the metric that answers a question most pipeline reports don’t: not how many deals are moving, but how fast finished revenue is actually exiting the system.
The formula pulls together four inputs:
- Number of opportunities
- Average deal size
- Win rate
- Average sales cycle length (in days)
Multiply the first three, divide by the fourth, and you get revenue per day flowing through your pipeline. Read that result as throughput, not activity. That distinction is what tells you where to actually intervene, because velocity doesn’t care how hard any single stage works.
It cares about what exits the system per day, which is a very different question from how many meetings got booked.
These four inputs describe the same funnel most teams already run, from first touch through closed revenue. If you want the stage map underneath the number, I’ve broken down how a B2B sales funnel is structured.
The sales velocity formula
A worked example makes the levers concrete. Say a B2B SaaS team is running:
- 50 qualified opportunities
- A $12,000 average deal size
- A 25 percent win rate
- A 90-day sales cycle
That’s 50 × $12,000 × 0.25, divided by 90, which comes out to $1,666 of new revenue per day.
Change any one input and the number moves, and that’s exactly why teams get tempted to push all four levers at once instead of finding the one actually constraining throughput.
Velocity versus pipeline velocity
Sales velocity and pipeline velocity describe the same throughput idea, with a minor scope difference. Sales velocity usually counts opportunities the sales team is actively working, while pipeline velocity sometimes reaches back to include earlier marketing-qualified stages.
Either way, the math and the lesson stay the same: throughput is one number set by the slowest part of the system, not an average of four independent dials.

Why pushing every stage at once does not increase velocity
Pushing every stage at once does not increase velocity because a funnel is one connected system, and a system’s throughput is set by its single tightest stage. The four formula inputs look like four equal levers, so the default move is to pull all of them at once. But that’s not what I see work.
The move I watch teams make first is spreading budget evenly across all four when only one of them is actually binding. Effort spent on stages that aren’t the constraint produces motion without lift, and it can even make the real bottleneck worse by piling more work in behind it.
This is the core insight of the Theory of Constraints, developed by physicist Eliyahu Goldratt in his book The Goal. Goldratt put the principle in one line that I think every RevOps owner should tape to the wall:
“An hour lost at a bottleneck is an hour lost for the entire system.”
— Eliyahu Goldratt, The Goal
Applied to a funnel, that means time and money spent speeding up a non-constraint stage returns nothing, because the constraint still caps what exits. If your demo-to-proposal step is the bind, doubling top-of-funnel traffic just deepens the queue sitting in front of it.
I’d push back on the articles that frame velocity as “improve all four variables.” They get the arithmetic right and the sequencing wrong. You don’t raise a throughput number by optimizing everywhere. You raise it by finding the one place the system is starved and treating that place first.

Why do B2B SaaS sales cycles keep getting longer?
B2B SaaS sales cycles keep getting longer because buying itself has become more complex, and cycle length is the denominator that drags velocity down directly.
A longer cycle lowers revenue per day even when every other input holds steady. I’d point to bigger buying committees and harder internal consensus as the real pressure here, not lazy reps or a weak product.
The scale of that complexity is well documented. According to Gartner’s B2B buying research, 77 percent of B2B buyers described their latest purchase as very complex or difficult, and buyers spend only 17 percent of the journey meeting with potential suppliers. That means most of the decision happens in rooms your reps are never in.
A committee compares options and builds internal agreement on its own clock, and each added stakeholder stretches the cycle further, pushing that denominator up.
The cycle-length denominator
Because cycle length sits at the bottom of the formula, shaving days off it is a legitimate velocity move, and often the cheapest lever available. A couple of ways this shows up in practice:
- Tightening the speed of first response
- Automating lead follow-up to remove dead time that no committee ever asked for
The trap is assuming cycle time is the whole answer. Cutting response lag only helps if the demand stage is actually the constraint.
If deals are dying after the sale, a faster front door just delivers them to the same downstream leak sooner.
Does adding more opportunities raise your velocity?
Adding more opportunities raises velocity only if the constraint sits at the top of the funnel, which in most B2B SaaS funnels it doesn’t.
More opportunities inflate the numerator on paper, but real throughput doesn’t move when those deals stall or die further down. Buying leads to fix a downstream constraint is, in my view, the most expensive way to make a velocity number look busy while revenue per day stays flat.
The downstream leak is bigger than most forecasts assume, and it isn’t lost to competitors.
Matthew Dixon and Ted McKenna’s analysis of more than 2.5 million recorded sales conversations for Harvard Business Review found that between 40% and 60% of deals today are lost to customers who express intent to purchase but ultimately fail to act. These are qualified buyers who wanted to buy and then did nothing.
Feeding more of them into the top of the funnel does nothing to fix the indecision that kills them later.
The numerator trap
The disciplined move is to make the numerator real before you make it bigger. An opportunity that’s going to die at no decision is a rounding error with a follow-up task attached. A couple of things that actually move this:
- Raising the quality of what enters the funnel, through qualifying and enriching leads, does more for velocity than raising the raw count
- Stripping out deals that were going to stall anyway keeps the numerator honest
When win rate and cycle length are the actual binds, adding opportunities is the wrong first move. Diagnose which input is starving the system before you spend on volume.
Where is the real constraint in most B2B SaaS funnels?
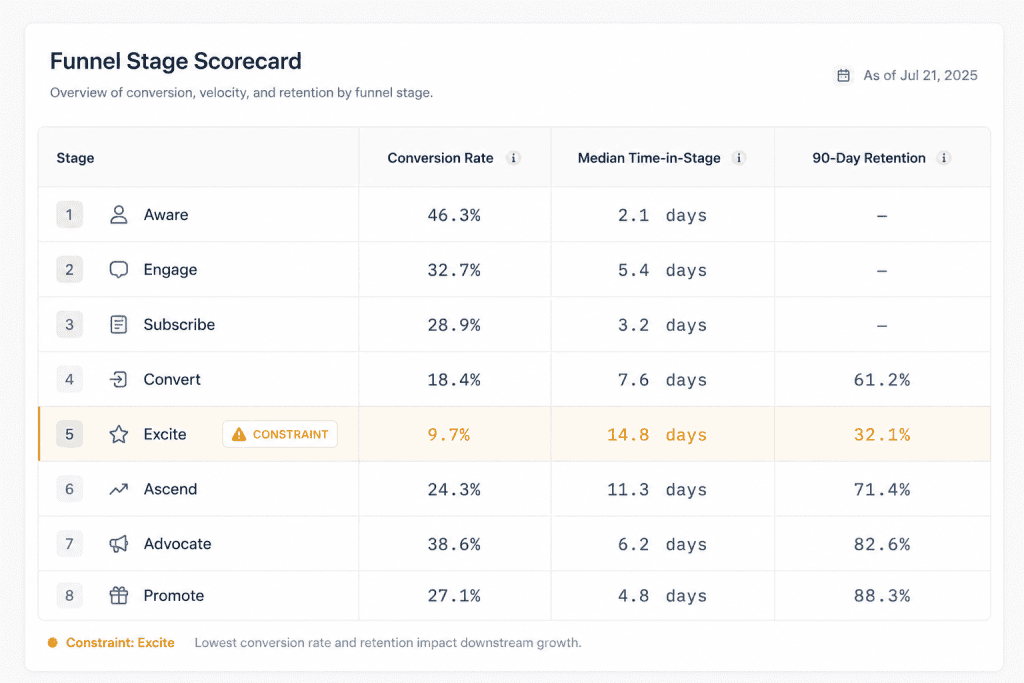
The pattern I keep hitting when I audit a stalled funnel is that the real constraint sits in the unengineered handoff right after the sale, what the Customer Value Journey calls the Convert-to-Excite gap.
A promise stretched during the close becomes a stalled first experience, then a silent customer, then churn. That leak caps lifetime value, which caps how much revenue the whole system can carry. It’s why a velocity problem so often turns out to be a retention problem in disguise.
The economics of that gap are unforgiving. According to Bain and Company’s retention research, increasing retention by just 5 percent can boost profits by as much as 95 percent.
A funnel that acquires well but loses customers in the first 90 days is pouring throughput into a bucket with a hole in the bottom.
No amount of top-of-funnel speed offsets a first experience that quietly breaks the promise made at conversion.
The Convert-to-Excite handoff
The failure mode here is specific. The Convert stage overpromises to get the signature; then the first 72 hours after purchase belong to no one.
The customer logs in, doesn’t reach a first win, and the gut feeling that they made a mistake sets in before the onboarding email even lands.
The recovery move is just as specific:
- Engineer the customer’s first tangible win inside those first days
- Tighten the promise made at Convert so the product can actually keep it
That’s a retention fix. But measured through the formula, it’s also a velocity fix, because retained revenue is the throughput the rest of the funnel exists to protect.
Retention economics cap throughput
A stage scorecard makes the constraint visible. I put two numbers side by side first: conversion rate and 90-day retention.
When conversion looks healthy while retention sags, the leak is in the handoff, not acquisition.
Reading those two numbers next to each other is how a disciplined team tells the difference between a funnel that’s genuinely slow and one that’s fast at the top and hemorrhaging at the bottom.
How do you calculate sales velocity and find your constraint?
You calculate sales velocity with the four-variable formula, then find your constraint by instrumenting conversion rate and time-in-stage for every stage and reading which one starves the rest.
The velocity number tells you how fast revenue exits. The per-stage data tells you where it gets stuck. You need both, because the headline number never names the bottleneck by itself.
Start with the calculation. Take a rolling 90-day window, count opportunities entered, multiply by average deal size and win rate, then divide by average cycle length.
A team at 50 opportunities, $12,000 average deal size, 25 percent win rate, and a 90 day cycle runs at roughly $1,666 per day. I’d recompute it monthly so the trend, not the snapshot, guides you.
Instrument every stage
Then instrument the funnel so the constraint shows itself:
- Record conversion rate from each stage to the next, not just the overall win rate
- Record median time-in-stage for every stage, because a stage can convert well and still stall the system on time
- Record 90-day retention alongside conversion, so a post-sale leak can’t hide behind healthy close rates
- Flag the single stage with the worst throughput that every later stage waits on
Read the stage that is starving the rest
The constraint is the stage everything else queues behind. If proposals convert at 60 percent but sit for 40 days, time-in-stage is the bind, not win rate.
If conversion is strong but retention drops at 90 days, the constraint is downstream of the sale.
Rigorous stage metrics are what separate diagnosis from guessing, and without them, a team optimizes by instinct and usually ends up fixing the wrong stage.
How do you increase funnel velocity by fixing the constraint?
You increase funnel velocity by fixing the one constraining stage, then re-measuring before you touch anything else. The sequence is find, fix, re-measure, repeat.
It’s deliberately slower than pulling all four levers at once, and that discipline is exactly what produces durable lift instead of motion. Optimizing everywhere spreads effort thin and hides which change actually worked.
The sequence runs in four moves:
- Instrument every stage and locate the single constraint
- Fix that stage only. For a Convert-to-Excite constraint, that means engineering the customer’s first win and tightening the onboarding promise so the product delivers what the close implied. Operational fixes that remove friction from that handoff, like automating the sales process so nothing stalls in a queue nobody owns, belong here
- Re-measure velocity and the stage metrics to confirm the number actually moved
- Only then move to the next tightest stage
What not to do
The anti-pattern is pushing all four velocity levers at once, or buying more opportunities, before diagnosing where the constraint actually sits. That’s the move that feels productive and changes nothing.
Diagnose first, treat the one stage that caps the system, and let the throughput number confirm the fix before you spend anywhere else.
What is the one constraint capping your funnel right now?
Every funnel has a single stage doing the most damage, and you cannot fix it until you can name it.
The first move worth running on your own pipeline is the diagnosis, not another round of top-of-funnel spend. Map your stage conversion rates, your time-in-stage, and your 90-day retention against the formula, and the constraint stops hiding.
Take the Growth Gap Scan to surface where your funnel is actually capped, so your next dollar goes to the one stage that will move the number.
Frequently Asked Questions
What is sales funnel velocity?
Sales funnel velocity is how fast opportunities turn into revenue over a set period. It is calculated as the number of opportunities times average deal size times win rate, divided by average sales cycle length, giving revenue per day. Read it as a throughput number set by the funnel’s single tightest stage, not an average of four independent levers.
How do you calculate sales funnel velocity?
Multiply your number of qualified opportunities by average deal size by win rate, then divide by average sales cycle length in days. For example, 50 opportunities times a 12,000 dollar deal times a 25 percent win rate, divided by a 90-day cycle, equals about 1,666 dollars of new revenue per day. Recompute monthly to track the trend.
What is a good sales funnel velocity?
There is no universal benchmark for sales funnel velocity, because deal sizes, win rates, and cycle lengths differ by market. A good velocity is one improving against your own baseline over time. The number rises when you find and fix the single stage constraining throughput, so track your trend rather than chasing an external target.
What is the difference between sales velocity and pipeline velocity?
Sales velocity and pipeline velocity describe the same throughput idea with minor scope differences. Sales velocity usually counts opportunities the sales team is actively working, while pipeline velocity sometimes includes earlier marketing-qualified stages. Both use the same four inputs, and both are capped by the slowest stage, so the diagnostic approach is identical for each.
Why is my funnel velocity slowing down even though I have more leads?
More leads inflate the numerator but do not raise real throughput when deals stall downstream. Dixon and McKenna found 40 to 60 percent of deals end in no decision, not lost to a competitor. If your constraint sits after the sale, at the Convert-to-Excite handoff, adding leads just feeds the same leak faster. Diagnose the constraint first.
How do you increase sales funnel velocity?
Instrument conversion rate and time-in-stage for every funnel stage, identify the single stage constraining throughput, and fix that one stage before touching anything else. For the common Convert-to-Excite constraint, engineer the customer’s first win and tighten the promise made at conversion. Re-measure to confirm the number moved, then repeat on the next tightest stage.
About the author
Brian helps B2B founders install marketing + automation engines powered by Co-Thinking with AI. With 15+ years building predictable revenue systems, he's worked with SaaS, agency, and service businesses on 90-day done-with-you growth accelerators.
Ready to see your real growth gap?
Two minutes in the Growth Gap Scan and you walk away knowing the one thing capping your pipeline. Free, no obligation.