B2B SaaS CRO: The Customer Value Journey Framework

Founder, Grow Predictably · 15+ yrs building B2B revenue systems
TL;DR: B2B SaaS CRO fails when teams borrow B2C tactics for a purchase that a committee makes slowly. Structure optimization around the stages a buyer actually moves through instead, give every stage one owned metric, fix speed and clarity before anything clever, and review the revenue numbers weekly. Test on a cadence, not on a whim.
Key takeaways
- The buyer is a committee, not a person, so proof that survives being forwarded beats any button-color test.
- Give each journey stage a single owner and a single number, so no leak sits unwatched between teams.
- Load speed and message clarity move conversion more than most redesigns, and they are cheap to fix.
- Four numbers decide the game: trial to paid, lead to demo, demo to close, and activation.
- The three failures that stall most programs are vanity dashboards, unowned metrics, and testing at random.
Most people struggle with B2B SaaS conversion rate optimization because they borrow what works in B2C.
It is a different game with different rules. SaaS buyers do not impulse buy. They research, evaluate, and loop in several other people before anyone signs, and if you optimize a single button while ignoring that committee, you are polishing the wrong surface.
What makes B2B SaaS CRO different from B2C?
The decision gets made by a buying group over months, rather than one shopper in a single session. That is the core difference, and it changes almost everything about conversion optimization. You are not persuading one visitor to click. You are helping six to ten people reach agreement, most of it in rooms you never see.
Gartner’s research on the B2B buying journey backs this up: a typical buying group involves 6 to 10 decision-makers, each doing their own research before they ever talk to you, and buyers now spend just 17% of the entire purchase cycle actually meeting with vendors.
Here’s the symptom I see most often: healthy top of funnel that never turns into real pipeline. Teams assume the call to action is weak, so they rewrite it, test it, rewrite it again. But that’s rarely the actual problem.
The real cause is usually that the site speaks to one persona while five other stakeholders on the buying committee show up, look for the answer to their specific objection, and find nothing.
Building for a committee instead of a single buyer means:
- Role-based landing pages that speak directly to each stakeholder’s version of the problem
- Content built to arm an internal champion, so they can make your case when you’re not in the room
- Proof points that hold up when forwarded to a skeptical finance lead who’s never heard of you
The shortcut everyone wants to take is testing the hero button. I get why.
It feels productive, it’s easy to measure, and it gives you something to report on. But it backfires, because it optimizes the sliver of the journey you can actually see and ignores the majority of the real decision, which is happening in Slack threads and internal emails you’ll never have access to.
Which framework should you use to optimize conversion?
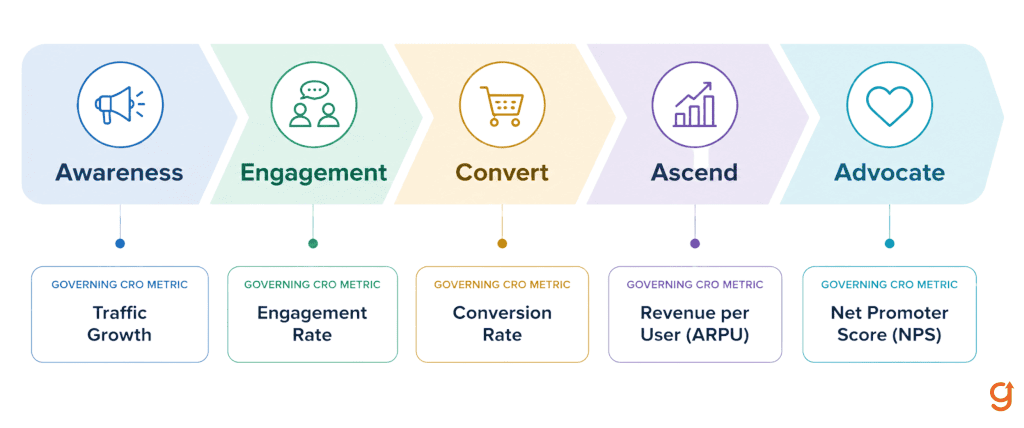
Map your optimization to the stages a buyer actually moves through, from first hearing about you to becoming an advocate. A flat funnel hides where the leak is. Working one stage at a time lets you assign a tailored move to each, which is what a long committee purchase needs, and it lets you see exactly what changed when you fix something.
Awareness. Get the right visitor to stay. Speed and clarity do the heavy lifting: Portent found a site that loads in one second converts roughly three times higher than one that loads in five. Run A/B tests on the headline and hero, and build separate landing pages by traffic source. If paid and organic traffic hit the same generic page, that is a fast win. The companion breakdown of B2B SaaS landing page conversion covers the page-level tactics.
Engagement. Lower the cost of the first yes. Break long forms into two or three steps and ask only the essential questions up front, then use progressive profiling to gather the rest later. Add social proof next to the form and test exit intent offers for visitors who are about to leave.
Convert. Get users to value fast. Guided product tours and a quick first success matter more than feature depth. Evidence closes deals here: the Demand Gen Report 2022 Content Preferences Survey found 55% of B2B buyers now rely more on content to research and make purchasing decisions than they did a year earlier, so the burden is on you to make that content clear, specific, and credible.
Ascend. Grow the accounts you already won. Watch usage patterns in your product analytics (Mixpanel or Amplitude), target power users for upsells, and test packaging on the pricing page.
Advocate. Turn wins into new pipeline. Ask for reviews right after a customer hits a success milestone, build a referral program that rewards both sides, and convert your best outcomes into case studies.
The discipline that ties it together: pick the leaking stage, run one experiment, measure, then move on. Do not optimize everything at once.
What metrics should you track weekly for CRO success?
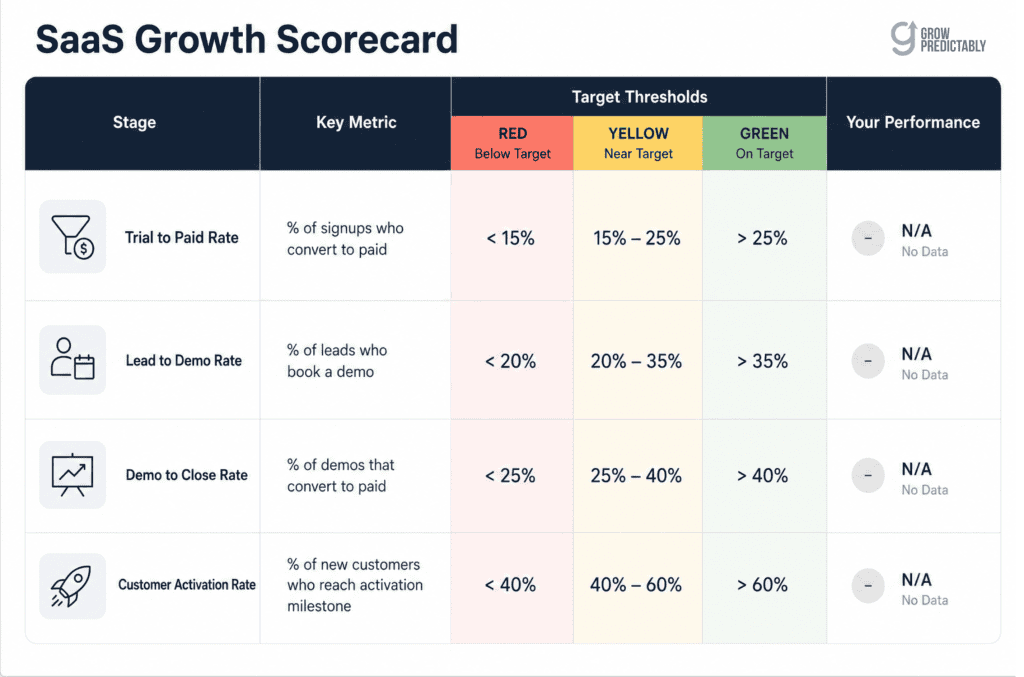
Track the four numbers that tie directly to revenue, and review them every week rather than whenever a report is due. Trial to paid, lead to demo, demo to close, and activation tell you whether the funnel is actually converting. Vanity metrics like followers and pageviews look nice and say nothing about whether anyone buys.
As Eric Ries writes in The Lean Startup, “Vanity metrics wreak havoc because they prey on a weakness of the human mind.”
Put these four on a simple red, yellow, green scorecard and read it every Monday. Treat the bands below as a starting bar from the programs I run, not an industry benchmark, and calibrate them against your own trend:
- Trial to paid rate. Red below 15%, yellow 15 to 25%, green above 25%.
- Lead to demo rate. Red below 20%, yellow 20 to 35%, green above 35%.
- Demo to close rate. Red below 25%, yellow 25 to 40%, green above 40%.
- Customer activation rate. Red below 40%, yellow 40 to 60%, green above 60%.
Give each number a single owner, tie it to comp where you can, and color code it weekly so a slip shows in days, not quarters. If you are still deciding which top line figure your board should watch alongside these, the companion piece on MRR vs ARR in B2B SaaS is a useful next read.
What are the most common B2B SaaS CRO mistakes?
The mistakes are predictable, and all three trace to the same root: measuring motion instead of money. Teams chase feel-good numbers, leave key metrics unowned, and skip testing because the page feels finished. Naming each one is usually most of the fix, because the problem is rarely effort and almost always where that effort points.
Chasing feel good numbers. The symptom is a slide full of green arrows (followers, impressions, list size) while revenue is flat. The cause is that nobody tied the dashboard to a purchase. The move is to replace vanity counts with trial-to-paid, activation within the first seven days, and demo completion. The anti-pattern is celebrating a traffic spike, because more unqualified visitors just dilute your conversion rate.
Nobody owns the number. When a metric belongs to everyone, it belongs to no one, so it drifts. Give marketing the lead quality score, product the activation rate, and sales the demo-to-close rate. When I audit a stalled program, the leak is almost always a number that lived between two teams, so neither one watched it. Put a single name on each metric and the drift stops.
Deciding you do not need to test. Teams sure their page is already perfect leave real money on the table. Forrester found that a superior user experience can raise visit-to-lead conversion by more than 400%, and you only capture that by testing rather than guessing. Run one change at a time, give each test at least two weeks and enough traffic to call a real winner, and document what you learn. The shortcut to avoid is copying a competitor’s page wholesale, because their traffic mix and budget are not yours, so their winner can be your loser.
What quick wins can you try this week?
Start with one small change, measure it, then move to the next. You do not need a redesign to move a number this week. A handful of specific, low-risk edits to your highest-traffic pages and your signup flow will compound faster than any single overhaul, and each one teaches you something about your buyers.
- Add a customer logo or short testimonial next to your signup button.
- Put price in context (“about two dollars a day” reads easier than “sixty a month”).
- Show a progress bar during signup so users see how close they are to done.
- Send a helpful email 24 hours after a trial starts, keyed to what the user has and has not tried.
- Cut one field from your highest traffic form.
If the team is thin, this is where light automation earns its keep. The guide to AI in B2B SaaS marketing automation shows how to trigger those onboarding and follow-up touches without adding headcount.
How do you know your CRO program is actually working?
You know it is working when a specific revenue number moves, and you can name the change that moved it. In every program I have turned around, the tell was the same: a tracked metric, an owned experiment, a visible result.
If you cannot connect a green number to a decision you made, you are still guessing.
Want a fast read on where your funnel leaks before you pick the first experiment? Score your funnel in a couple of minutes and start with the stage that needs it most.
Frequently Asked Questions About B2B SaaS CRO
What is a good conversion rate for B2B SaaS?
It depends on the metric and stage, which is why a single site-wide number is misleading. Use stage benchmarks instead: aim for trial to paid above 25%, demo to close above 40%, and activation above 60%, and compare each against your own trend rather than an industry average.
How is CRO different from A/B testing?
A/B testing is one tactic inside CRO. CRO is the full discipline of diagnosing where and why visitors fail to convert across the journey, then choosing the right intervention, which is sometimes a test and sometimes a structural fix like faster load time or clearer role-based messaging.
How long before CRO shows results?
Quick wins like form and speed fixes can show up within a few weeks, but statistically valid test results usually need at least two weeks per test plus enough traffic to reach significance. On long B2B cycles, downstream metrics like demo to close can take a full quarter to confirm.
What is a CRO platform?
A CRO platform is software that helps you test and improve conversion, typically combining A/B and multivariate testing, heatmaps and session recordings, and form analytics. Pair it with product analytics and your CRM so you can trace a change all the way to revenue.
About the author
Brian helps B2B founders install marketing + automation engines powered by Co-Thinking with AI. With 15+ years building predictable revenue systems, he's worked with SaaS, agency, and service businesses on 90-day done-with-you growth accelerators.
Ready to see your real growth gap?
Two minutes in the Growth Gap Scan and you walk away knowing the one thing capping your pipeline. Free, no obligation.